
|
|
|
Font Size:
|
||||
|
|
|
|
||||
Average Annual Total Expenses, Total Utilization, and Sources of Payment for Outpatient Prescription Opioids in the U.S. Adult Civilian Noninstitutionalized Population, 2021-2022
Statistical Brief #559 | February 2025 | Xue Wu, PhD, Asako S. Moriya, PhD, and G. Edward Miller, PhD
Highlights
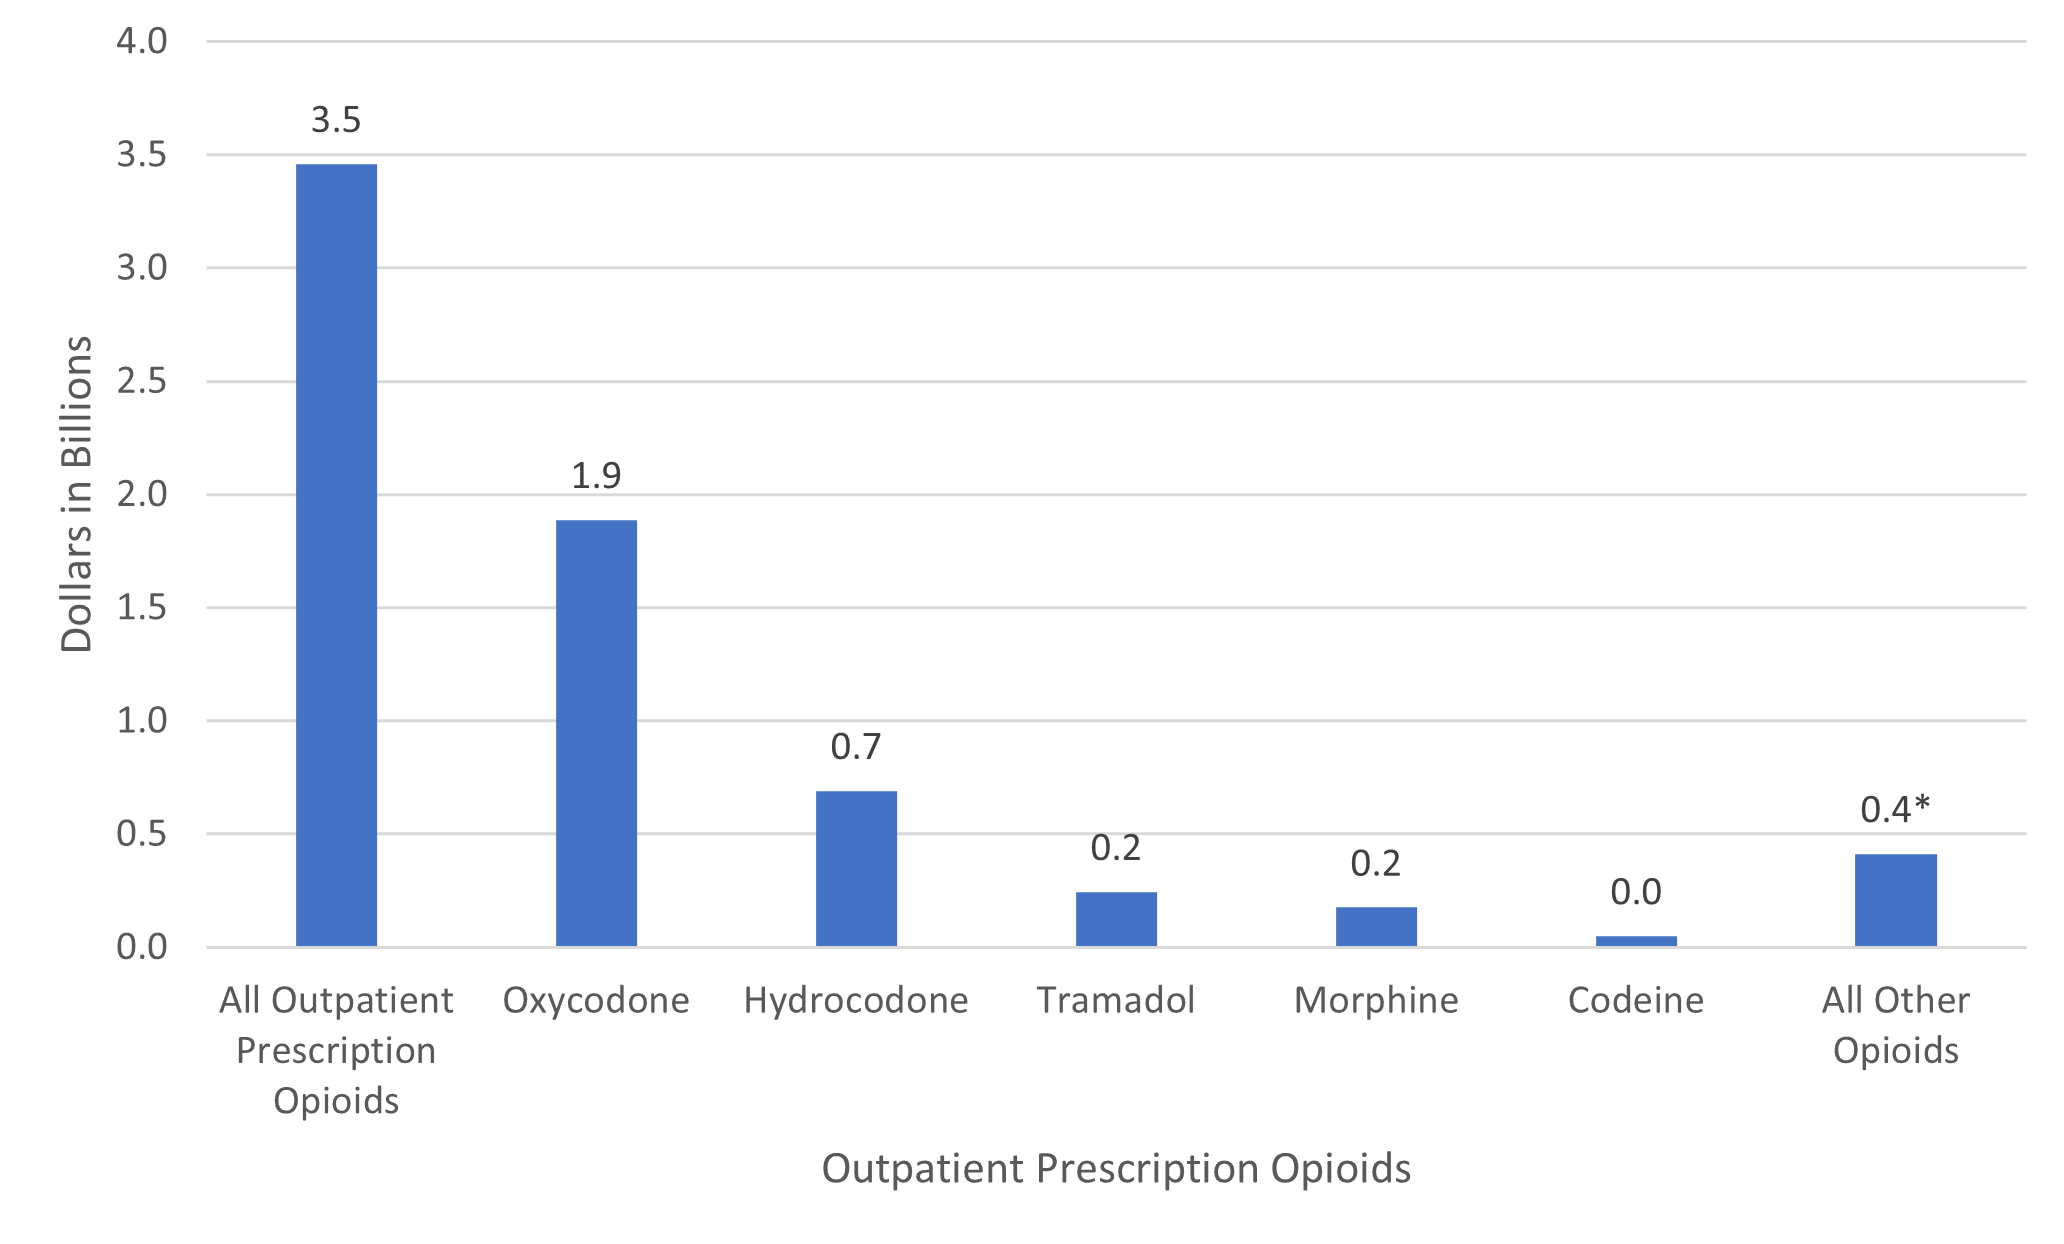
- In 2021-2022, average annual total outpatient prescription opioid expenses for adults were $3.5 billion, with oxycodone and hydrocodone together accounting for nearly 75 percent of total spending ($1.9 and $0.7 billion, respectively).
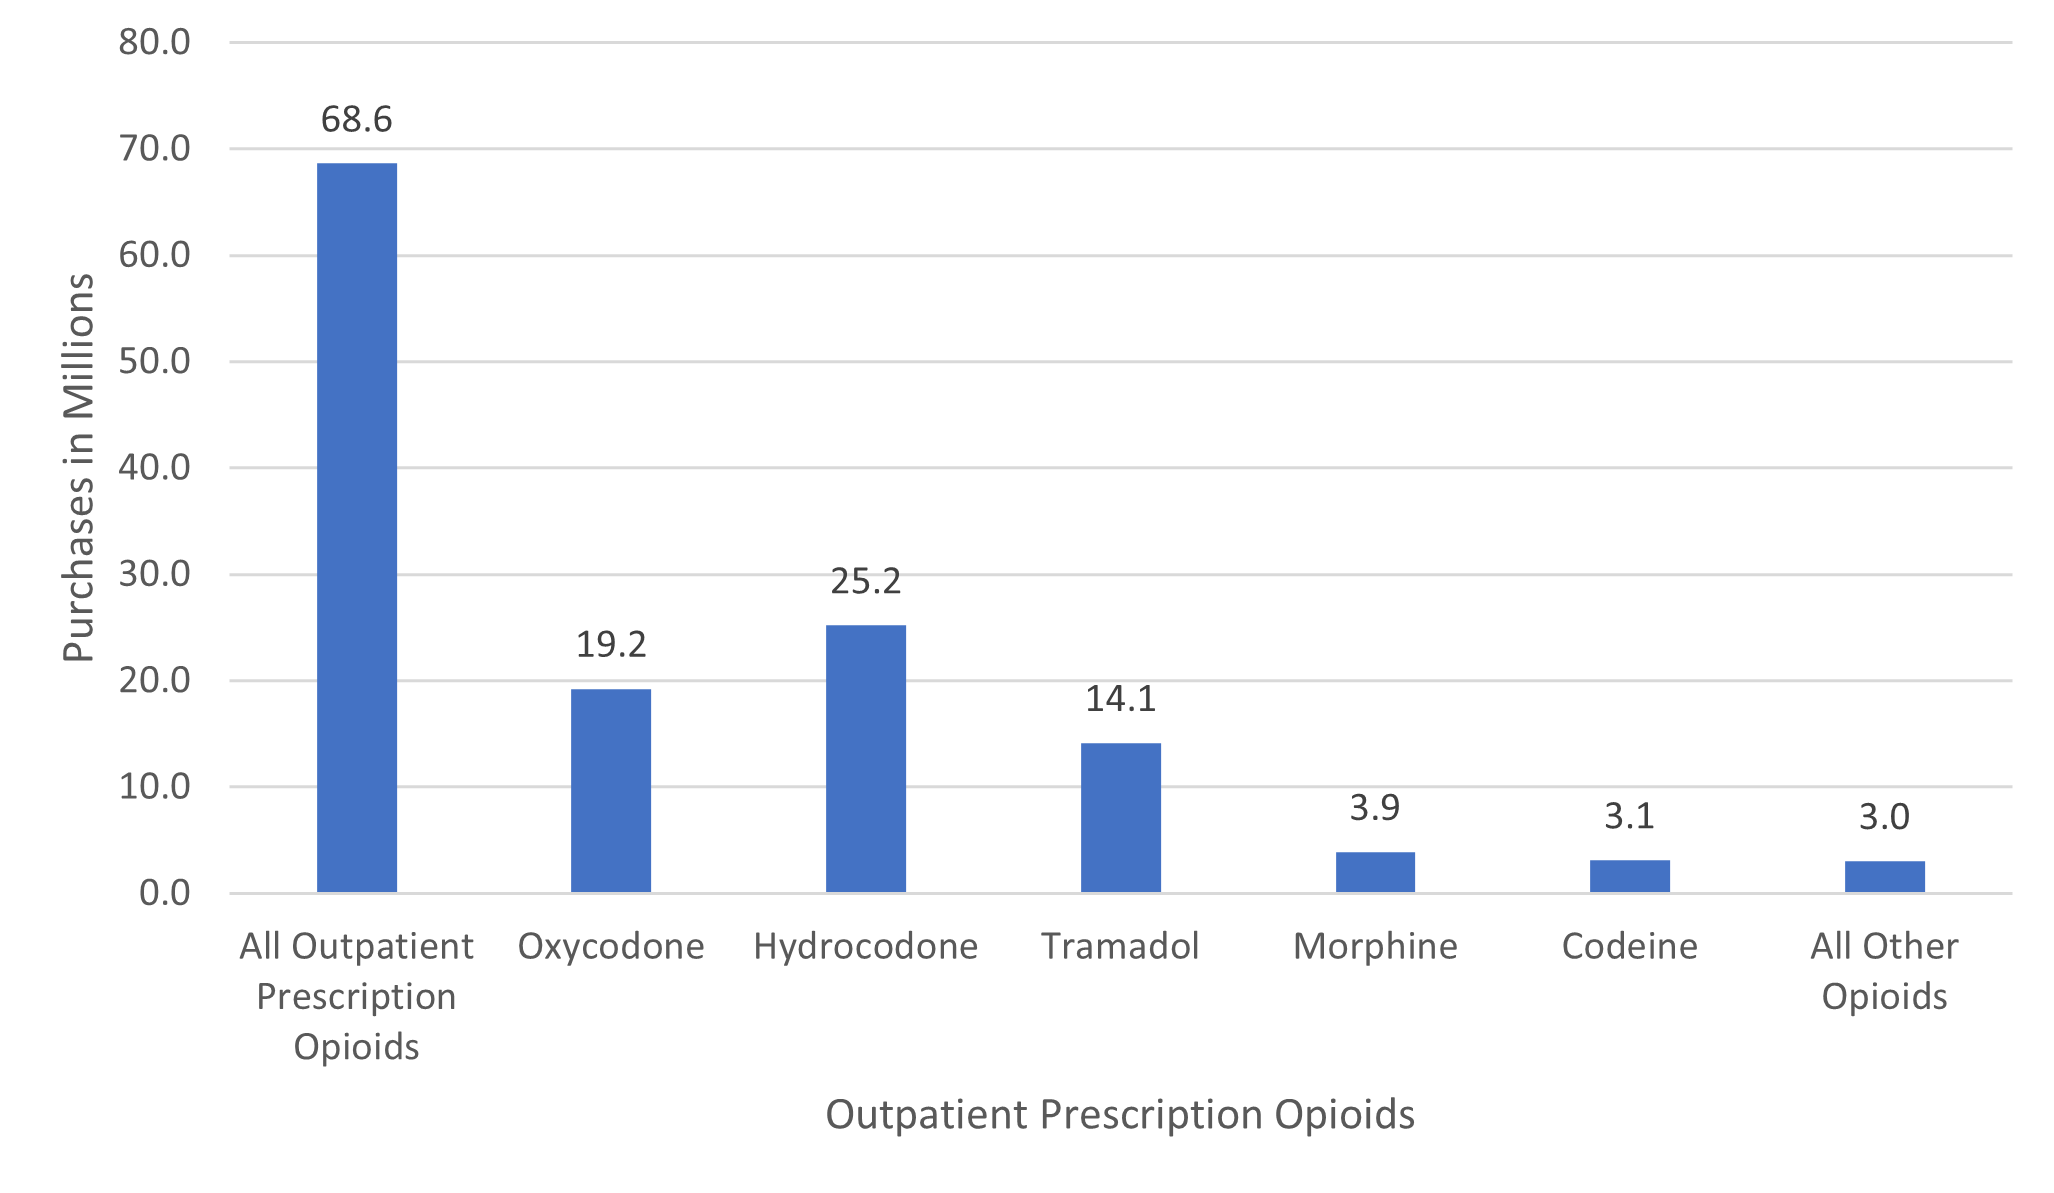
- Total outpatient prescription opioid fills for adults totaled 68.6 million, with hydrocodone, oxycodone, and tramadol accounting for the majority of these fills (25.2 million, 19.2 million, and 14.1 million fills, respectively).
- Average annual total spending per person with any use for all outpatient prescription opioids in 2021-2022 was $174, with out-of-pocket costs averaging $31.
- Of the top five opioids (ranked by expenditures), medications containing oxycodone and morphine had the highest average annual spending per user at $282 and $234, respectively. Oxycodone also had the highest average total payment per fill at $99.
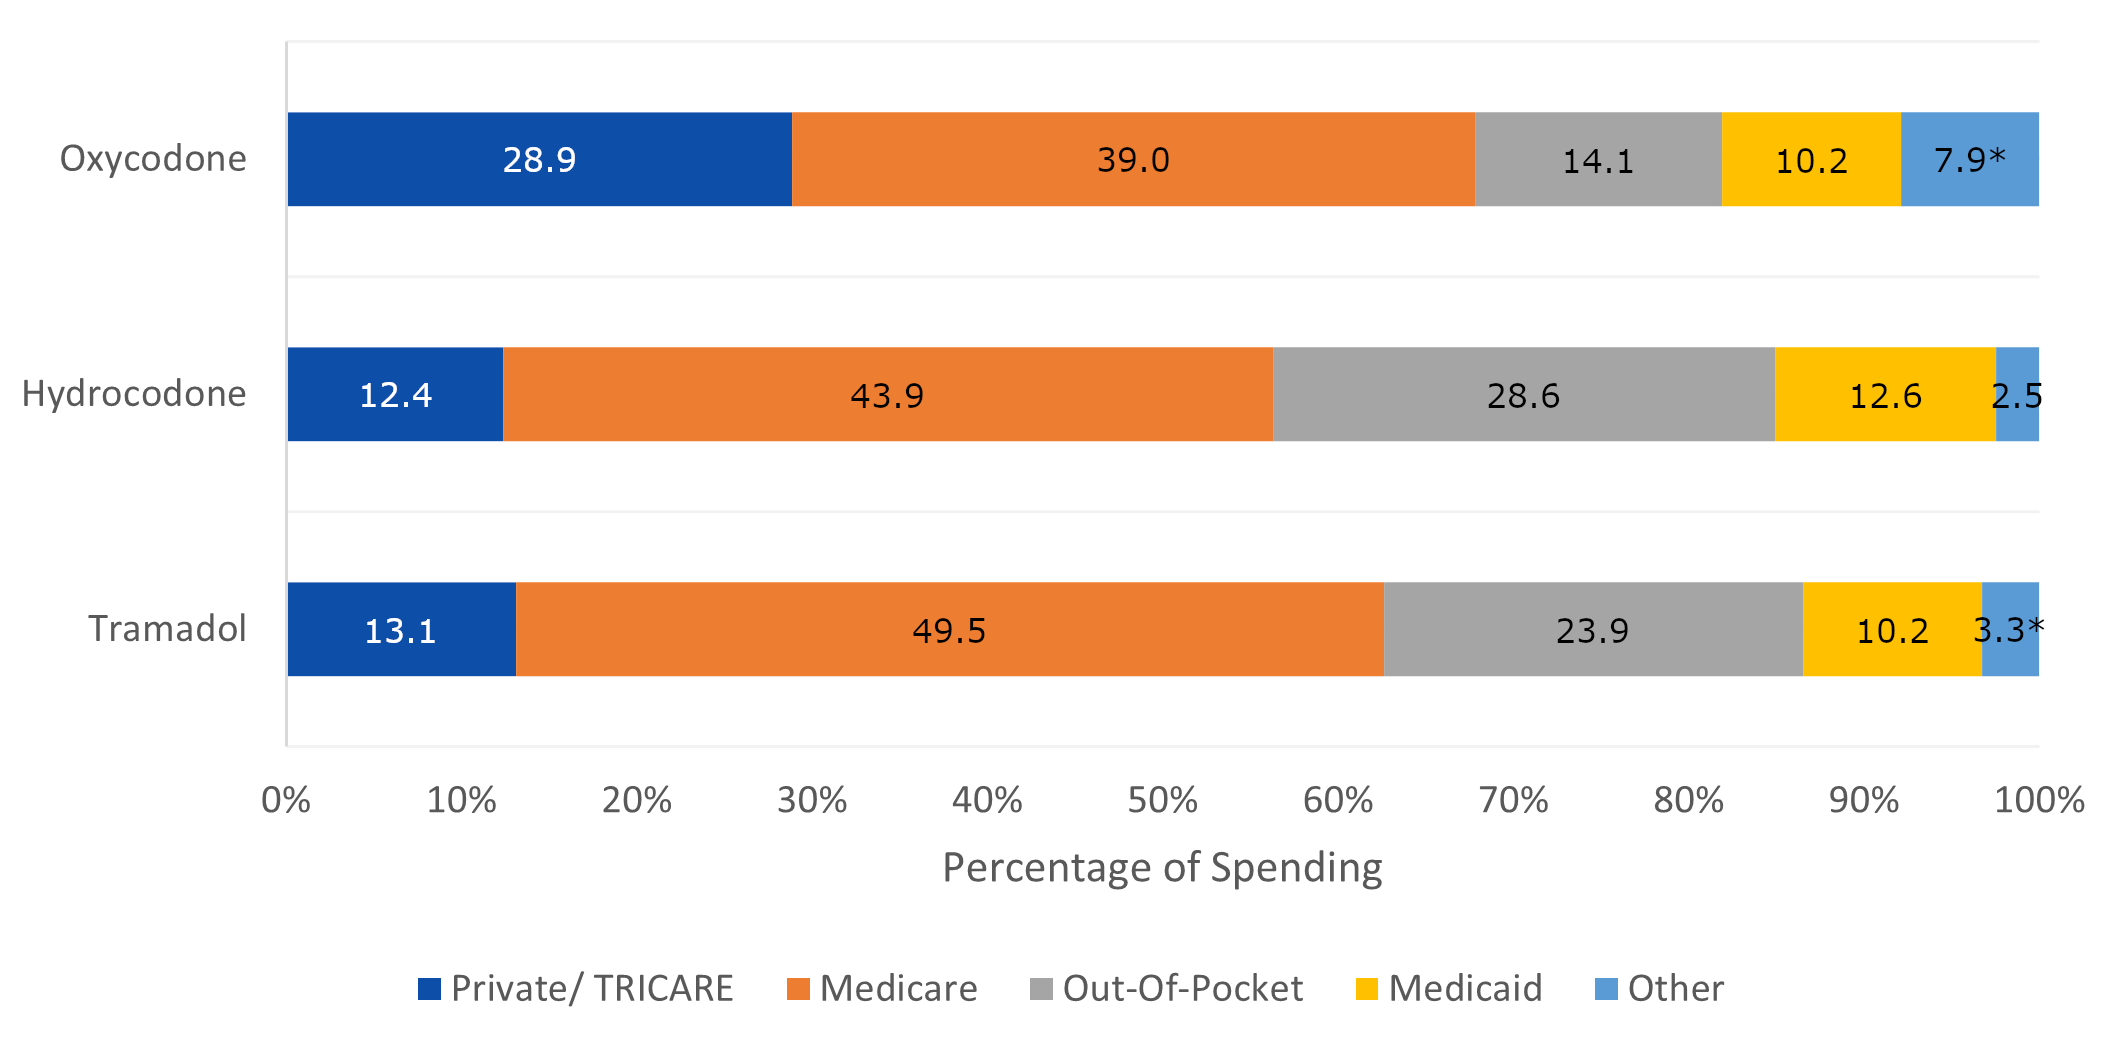
- On average, Medicare covered a larger portion of the spending for hydrocodone (43.9 percent), oxycodone (39.0 percent), and tramadol (49.5 percent) than other insurers.
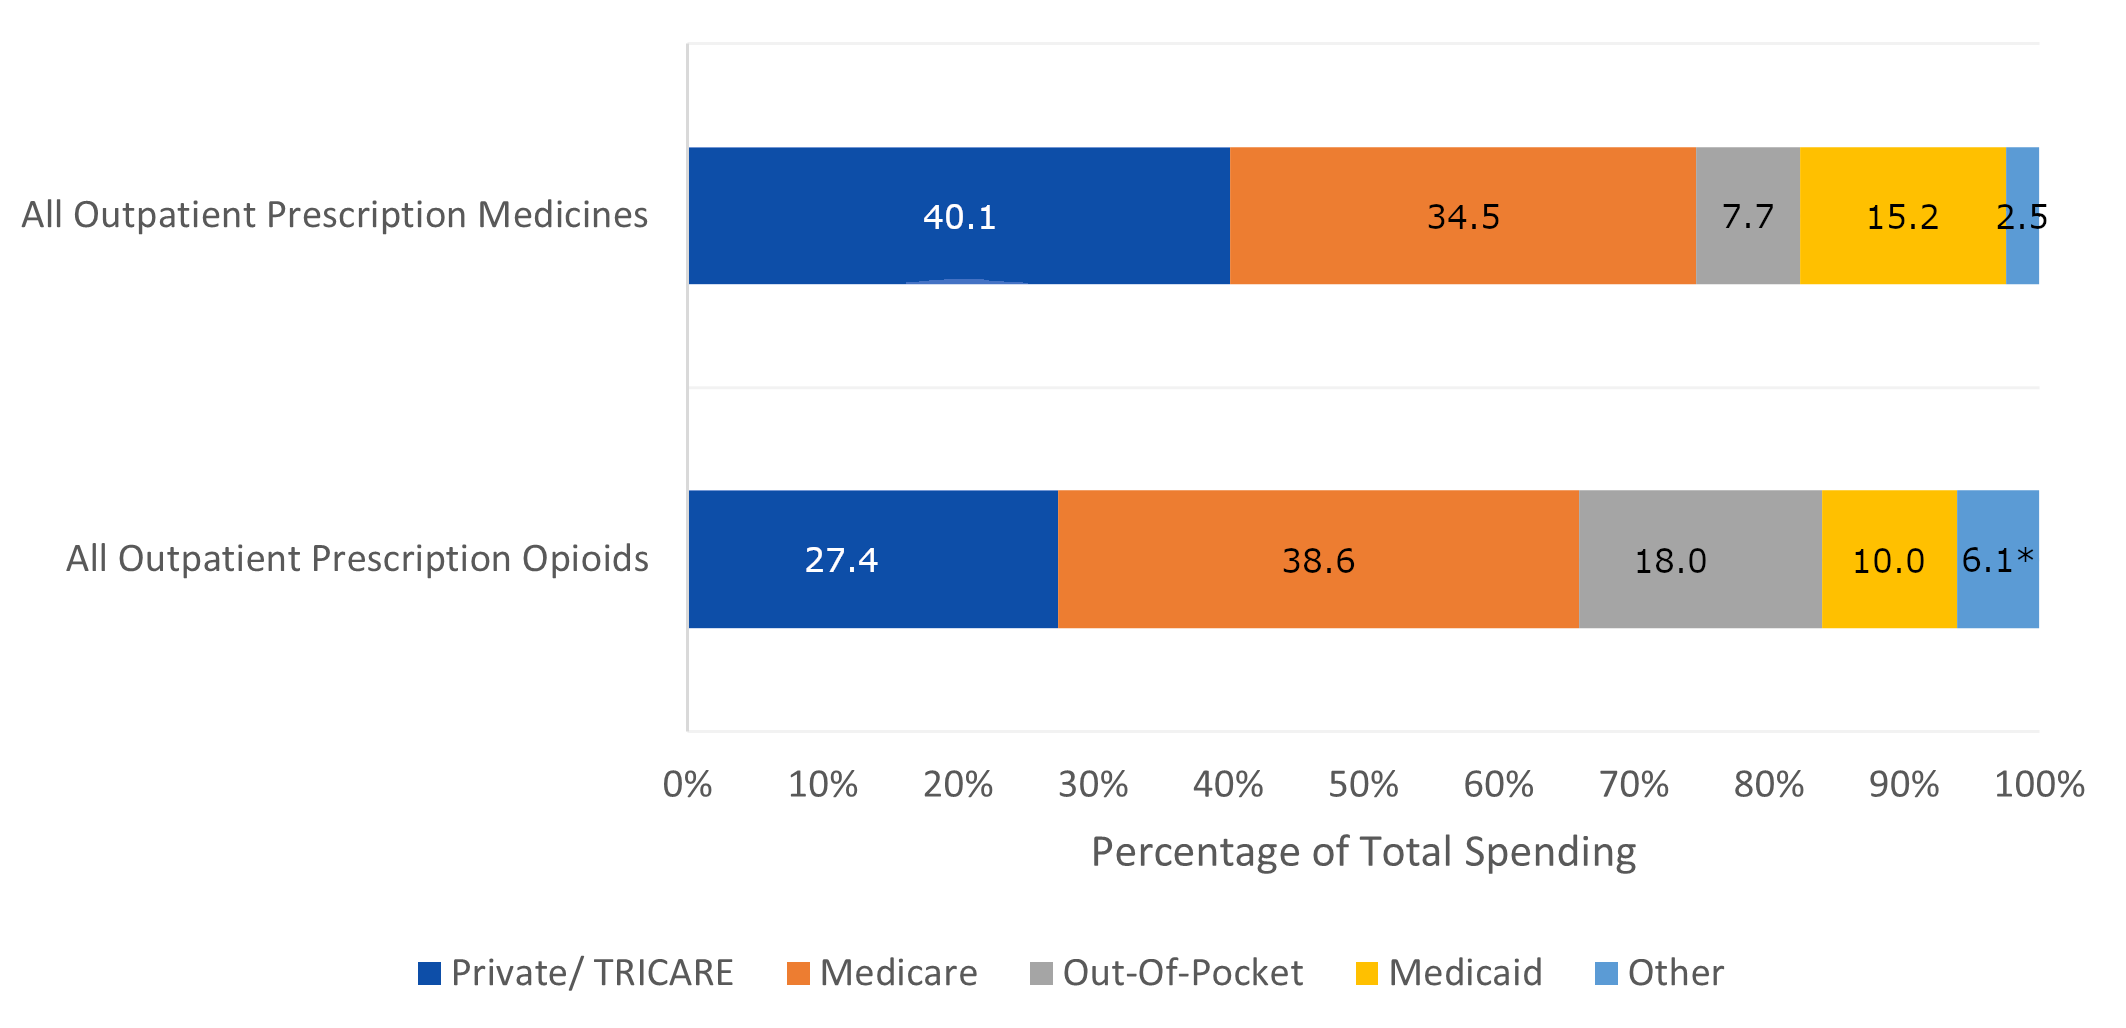
- In 2021-2022, the share of spending financed by private insurance / TRICARE was larger for all prescription drugs (40.1 percent) than for opioids (27.4 percent) while the Medicare share of spending was similar for all drugs (34.5 percent) and opioids (38.6 percent).
Introduction
Utilization of and expenditures for opioids for pain management continue to be critical areas of research due to the significant impact these medications have on both public health and the economy. Despite the significant decline in prescription opioid use since 2011,a as evidenced by previous publications showing a reduction in total opioid fills and refills from 152.8 million in 2015 to 110.4 million in 2017,1 the opioid crisis remains a serious concern, as the crisis continues to be marked by high rates of misuse, addiction, and overdose deaths.2 The financial burden of outpatient prescription opioids on the U.S. civilian non-institutionalized adult population is substantial, reflecting both high total payments and significant out-of-pocket expenses.
This Statistical Brief investigates opioid utilization and expenditures among adults (ages 18 and older) within the U.S. civilian non-institutionalized population. Utilizing data from the Medical Expenditure Panel Survey (MEPS) Household Component (HC), we provide estimates of total expenses, total fills, and sources of payment for outpatient prescription opioids for pain. Additionally, the brief presents the same measures for the top five opioid products ranked by total expenses in 2021-2022: Oxycodone, hydrocodone, tramadol, morphine, and codeine.
Because of methodological and definitional differences, readers should use caution when comparing MEPS estimates of opioid expenditures and utilization with estimates from other sources. Details on the MEPS methodology and differences with other sources are included in the Definitions section of this Statistical Brief.
Findings
Expenditures (figure 1)
In 2021-2022, average annual spending on all outpatient prescription opioids totaled $3.5 billion. Oxycodone accounted for the highest total expenditures at $1.9 billion, followed by hydrocodone at $0.7 billion. Both morphine and tramadol had expenditures of $0.2 billion. Codeine, as well as all other opioids combined, incurred expenses less than $0.1 billion and $0.4 billion respectively.
Utilization (figure 2)
The average annual total number of purchases for all outpatient prescription opioids was 68.6 million. Hydrocodone was the most frequently purchased opioid, with 25.2 million fills, followed by oxycodone at 19.2 million fills. Tramadol had 14.1 million fills, while morphine and codeine had 3.9 million and 3.1 million fills, respectively. Other opioids combined accounted for 3.0 million fills.
Distribution of spending by sources of payment (figure 3, figure 4)
In 2021-2022, private insurance/TRICARE and Medicare combined to finance about three-quarters of the payments for all outpatient prescription drugs and two-thirds of the payments for all outpatient prescription opioids. The share of spending financed by private insurance / TRICARE was larger for all prescription drugs (40.1 percent) than for opioids (27.4 percent) but there was not a statistically significant difference in the Medicare share between opioids (38.6 percent) and all drugs (34.5 percent). Results also show that the share of payments financed by out-of-pocket spending was lower for all drugs (7.7 percent) than for opioids (18.0 percent), but there were no statistically significant differences in the shares of spending financed by Medicaid and other insurers.
For hydrocodone, Medicare accounts for the largest share of spending at 43.9 percent, followed by out-of-pocket at 28.6 percent. Spending on oxycodone is dominated by Medicare (39.0 percent) and private insurance / TRICARE (28.9 percent). Tramadol has the highest spending through Medicare (49.5 percent), with significant portions also coming from out-of-pocket (23.9 percent) and private insurance / TRICARE (13.1 percent). Each payer type's contribution varies across the different medications, possibly reflecting varying patterns of need and utilization among enrollees.
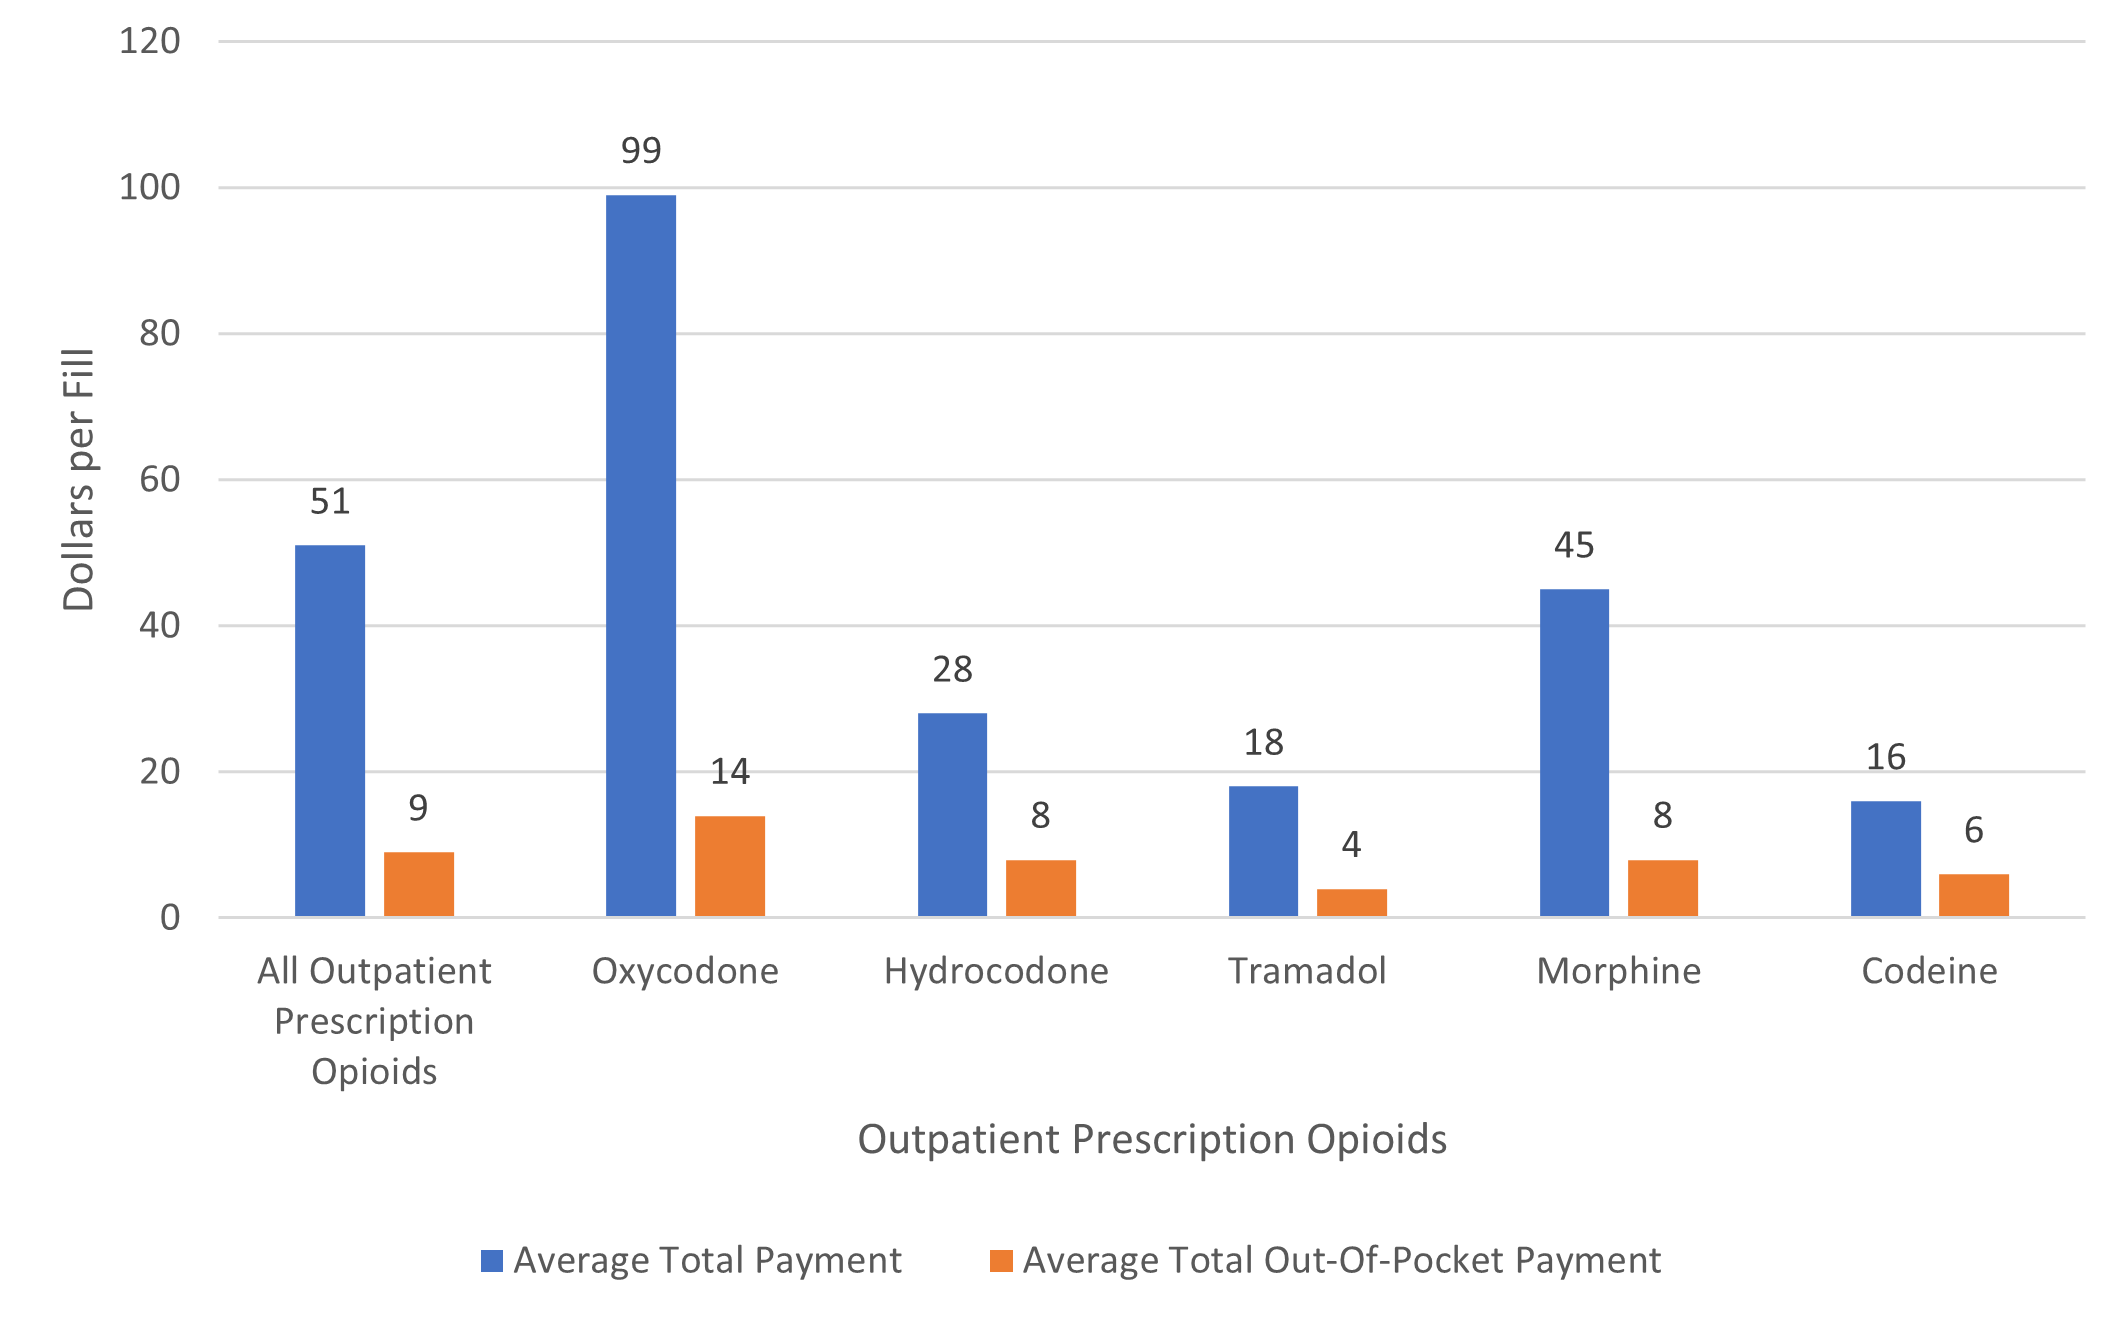
Per fill average spending (figure 5)
For all outpatient prescription opioids combined, the average annual total payment per fill stands at $51, with an average out-of-pocket payment of $9. Among the specific opioids, oxycodone exhibits the highest average total payment per fill at $99, with an average out-of-pocket expense of $14. Morphine follows with an average total payment of $45 and an out-of-pocket cost of $8 per fill. Hydrocodone has an average total payment of $28 per fill, and an out-of-pocket expense of $8. Tramadol and codeine have an average total payment of $18 and $16 per fill, with out-of-pocket expenses of $4 and $6, respectively.
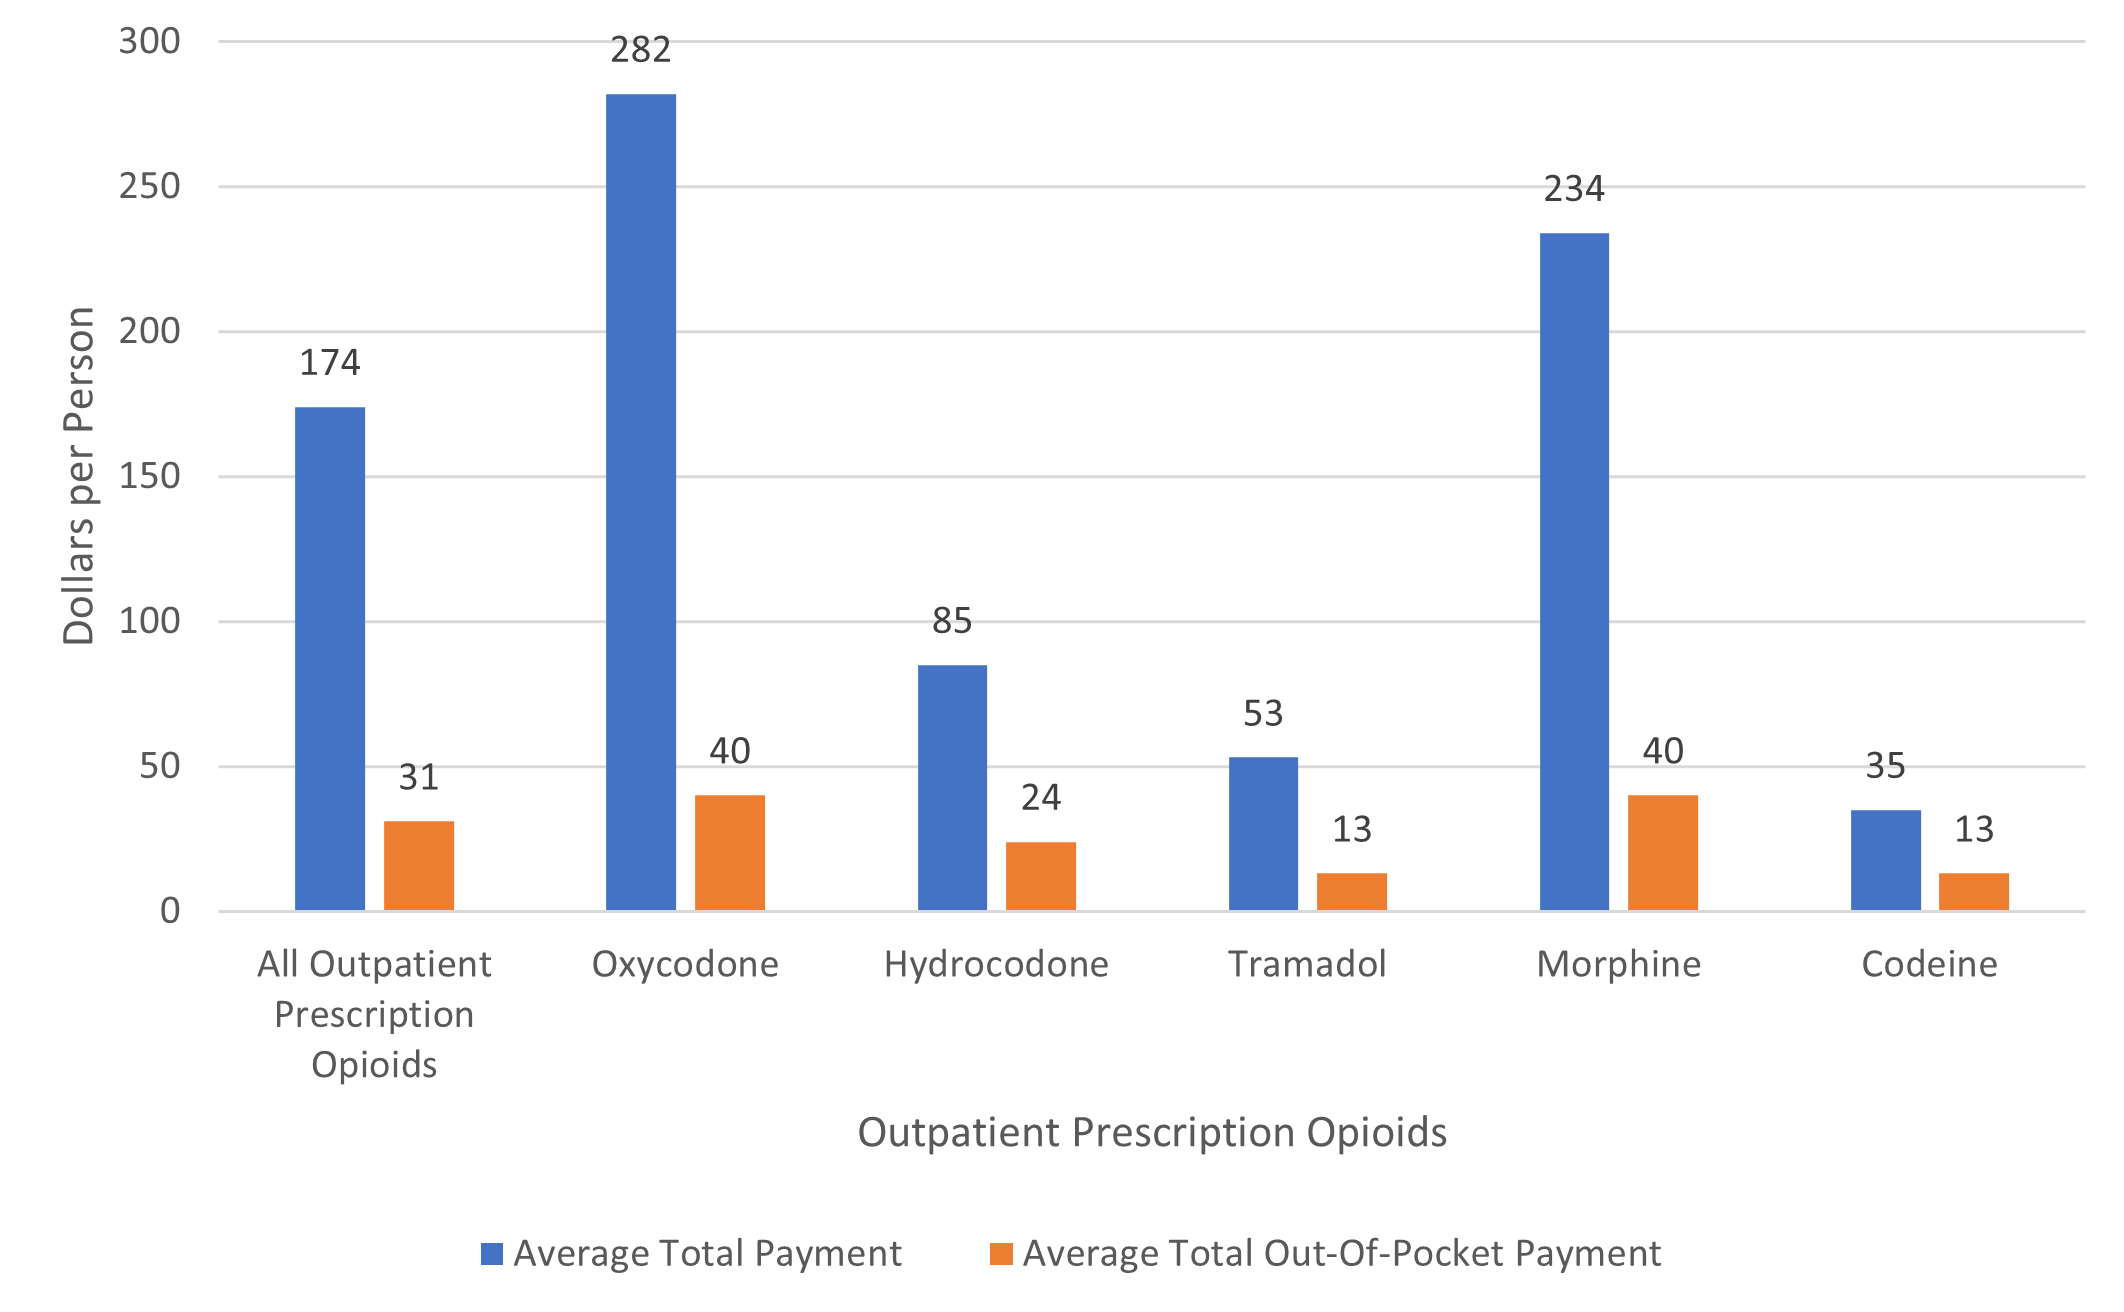
Per person average spending (figure 6)
Average annual total spending for opioids per person with any use was $174 in 2021-2022, with an average annual out-of-pocket expense of $31. Among individual opioids, oxycodone had the highest average annual spending per user at $282 and an out-of-pocket payment of $40. Morphine follows with average annual spending per user of $234, and the same out-of-pocket cost of $40. Hydrocodone and tramadol show somewhat lower average annual total spending of $85 and $53, respectively, with out-of-pocket costs of $24 and $13. Codeine has the lowest total payment at $35, with an out-of-pocket payment of $13. Overall, out-of-pocket costs are consistently much lower than the total payments across all opioids, with oxycodone having the highest total cost and codeine the lowest.
Data Source
The estimates in this Statistical Brief are based upon data from the 2022 FY Consolidated File (HC-243), 2021 FY consolidated File (HC-233), and a non-public version of the 2021, 2022 Prescribed Medicines Data File.
Definitions
Utilization
Utilization was defined as the acquisition of outpatient prescription opioid fills during the specified year (2021 & 2022, in this Statistical Brief). This includes both refills and original prescriptions, which are factored into the expense and utilization estimates.
MEPS estimates of opioid use may vary from those based on other data sources due to several factors. For instance, the methodologies and objectives of MEPS and the Substance Abuse and Mental Health Services Administration's (SAMHSA) National Survey on Drug Use and Health (NSDUH) differ significantly. NSDUH's estimates encompass both prescribed opioid use and misuse, where misuse includes taking medications for the feeling they produce or in a manner not prescribed by a doctor. NSDUH respondents report use in both inpatient and outpatient settings. Additionally, NSDUH employs targeted questions with show cards for specific drugs, utilizes self-reporting through audio computer-assisted self-interviewing (ACASI), surveys individuals aged 12 and older, and collects data based on a 12-month recall period.
In contrast, MEPS includes only prescribed medicines purchased in outpatient settings, such as retail and mail-order pharmacies. Prescription medicines administered in inpatient settings or in clinics or physicians' offices are excluded. MEPS data are reported by households, with one respondent providing information for the entire household. MEPS uses computer-assisted personal interviewing (CAPI) and gathers information based on a typical recall period of 3-6 months. Furthermore, this Statistical Brief reports estimates for adults aged 18 years and older. The net effect of these differences is that MEPS estimates of opioid use will typically be significantly lower than NSDUH estimates.
All opioids and opioid products: Hydrocodone, oxycodone, tramadol, morphine, and codeine
Opioids that are commonly used to treat pain are defined using generic drug names for narcotic analgesics and narcotic analgesic combinations in the Multum Lexicon database from Cerner Multum, Inc. We identified slightly more opioids commonly used for pain than one would find in the MEPS public use files due to methods used to preserve the confidentiality of sample members. We excluded opioids not used for pain management from this analysis.
Expenses
Expenses encompass the total direct payments made by all sources to pharmacies for the prescriptions reported by respondents in the MEPS-HC. In producing average estimates for 2021-2022 data combined, the 2021 expense data were adjusted to 2022 dollars, using the Bureau of Labor Statistics' Consumer Price Index (CPI) for prescription drugs, for 2 years (https://meps.ahrq.gov/about_meps/Price_Index.shtml). It is important to note that manufacturer rebates to payers and pharmacy benefit companies were not measured and, therefore, were not deducted from the total direct payments.
Age
Age was defined using the last available age in 2021-2022 for each sampled person. Adults were defined as persons equal to or greater than 18 years of age.
Sources of payment
- Out-of-pocket: This category includes expenses paid by the user or other family members.
- Private insurance/TRICARE: This category includes payments made by insurance plans covering hospital and medical care (excluding payments from Medicare, Medicaid, and other public sources). Payments from Medigap plans or TRICARE (Armed Forces-related coverage) are included.
- Medicare: Medicare is a federally funded health insurance program primarily serving individuals aged 65 and older. Additionally, it provides coverage for persons receiving Social Security disability benefits and those diagnosed with end-stage renal disease (ESRD). Medicare Part D provides prescription drug coverage.
- Medicaid: Medicaid is a government program, funded collaboratively by federal and state resources, aimed at offering healthcare to eligible individuals based on financial need. The eligibility requirements for Medicaid vary widely from state to state, reflecting diverse policy decisions and demographic needs.
- Other sources: This category includes payments from the Department of Veterans Affairs; other federal sources (Indian Health Service and other care provided by the federal government, except TRICARE); various state and local sources (community and neighborhood clinics, state and local health departments, and state programs other than Medicaid (STL)); Workers' Compensation; various unclassified sources (e.g., automobile, homeowner's, or other liability insurance), and other miscellaneous or unknown sources.
About MEPS-HC
The MEPS-HC collects nationally representative data on healthcare use, expenditures, sources of payment, and insurance coverage for the U.S. civilian noninstitutionalized population. The MEPS-HC is cosponsored by the Agency for Healthcare Research and Quality (AHRQ) and the National Center for Health Statistics (NCHS). More information about the MEPS-HC can be found at https://meps.ahrq.gov/.
For a detailed description of the MEPS-HC survey design, sample design, and methods used to minimize sources of nonsampling error, see the following publications:
Cohen, J. Design and Methods of the Medical Expenditure Panel Survey Household Component. MEPS Methodology Report No. 1. AHCPR Pub. No. 97-0026. 1997. Agency for Health Care Policy and Research (AHCPR), Rockville, MD. https://meps.ahrq.gov/data_files/publications/mr1/mr1.pdf
Cohen S. Sample Design of the 1996 Medical Expenditure Panel Survey Household Component. MEPS Methodology Report No. 2. AHCPR Pub. No. 97-0027. 1997. Agency for Health Care Policy and Research, Rockville, MD. https://meps.ahrq.gov/data_files/publications/mr2/mr2.pdf
References
1 Ding Y, Miller GE. Total expenses, total utilization, and sources of payment for outpatient prescription opioids in the US adult civilian noninstitutionalized population, 2017. Statistical Brief #529. April 2020. Agency for Healthcare Research and Quality, Rockville, MD. https://meps.ahrq.gov/data_files/publications/st529/stat529.pdf
2 Volkow ND, Jones EB, Einstein EB, Wargo EM. Prevention and treatment of opioid misuse and addiction: a review. JAMA psychiatry. 2019;76(2):208-216.
3 Haley DF, Saitz R. The opioid epidemic during the COVID-19 pandemic. JAMA. 2020;324(16):1615-1617.
Suggested Citation
Wu, X., Moriya, A.S. and Miller, G.E. Total Expenses, Total Utilization, and Sources of Payment for Outpatient Prescription Opioids in the U.S. Adult Civilian Noninstitutionalized Population, 2021-2022. Statistical Brief #559. October 2024. Agency for Healthcare Research and Quality, Rockville, MD. https://meps.ahrq.gov/data_files/publications/st559/stat559.shtml
Notes
a https://www.iqvia.com/insights/the-iqvia-institute/reports-and-publications/reports/prescription-opioid-trends-in-the-united-states.AHRQ welcomes questions and comments from readers of this publication who are interested in obtaining more information about access, cost, use, financing, and quality of healthcare in the United States. We also invite you to tell us how you are using this Statistical Brief and other MEPS data and tools and to share suggestions on how MEPS products might be enhanced to further meet your needs. Please email us at MEPSProjectDirector@ahrq.hhs.gov or send a letter to the address below:
Joel W. Cohen, PhD, Director
Center for Financing, Access and Cost Trends
Agency for Healthcare Research and Quality
5600 Fishers Lane, Mailstop 07W41A
Rockville, MD 20857
Figure 1. Average annual total expenses for all outpatient prescription opioids and the top opioid products,^ U.S. civilian noninstitutionalized adult population, 2021-2022
| Outpatient Prescription Opioids | Average annual total expenses (in billions) for all outpatient prescription opioids and the top opioid products |
|---|---|
| All Outpatient Prescription Opioids | 3.5 |
| Oxycodone | 1.9 |
| Hydrocodone | 0.7 |
| Tramadol | 0.2 |
| Morphine | 0.2 |
| Codeine | 0.0 |
| All Other Opioids | 0.4* |
Note: ^ Products containing specific opioids ranked by annual total expenses in 2021-2022;
* Relative standard error is greater than 30 percent.
Source: Center for Financing, Access, and Cost Trends, AHRQ, Household Component of the
Medical
Expenditure Panel Survey, 2021-2022
Figure 2. Average annual total fills for all outpatient prescription opioids and the top opioid products,^ U.S. civilian noninstitutionalized adult population, 2021-2022
| Outpatient Prescription Opioids | Average annual total fills (in millions) for all outpatient prescription opioids and the top opioids products |
|---|---|
| All Outpatient Prescription Opioids | 68.6 |
| Oxycodone | 19.2 |
| Hydrocodone | 25.2 |
| Tramadol | 14.1 |
| Morphine | 3.9 |
| Codeine | 3.1 |
| All Other Opioids | 3.0 |
Note: ^ Products containing specific opioids ranked by annual total expenses in
2021-2022.
Source: Center for Financing, Access, and Cost Trends, AHRQ, Household Component of the
Medical Expenditure Panel Survey, 2021-2022
Figure 3. Average annual distribution of spending by source of payment for all outpatient prescription medicines and all outpatient prescription opioids, U.S. civilian noninstitutionalized adult population, 2021- 2022
| Category | Private/TRICARE | Medicare | Out-Of-Pocket | Medicaid | Other |
|---|---|---|---|---|---|
| All Outpatient Prescription Medicines | 40.1 | 34.5 | 7.7 | 15.2 | 2.5 |
| All Outpatient Prescription Opioids | 27.4 | 38.6 | 18.0 | 10.0 | 6.1* |
Note: * Relative standard error is greater than 30 percent. Percentages may not add to exactly 100.0 due
to rounding.
Source: Center for Financing, Access, and Cost Trends, AHRQ, Household Component of the
Medical Expenditure Panel Survey, 2021-2022
Figure 4. Average annual distribution of spending by source of payment for top opioid products, U.S. civilian noninstitutionalized adult population, 2021-2022
| Opioid Product | Private/TRICARE Spending (%) | Medicare Spending (%) | Out-Of-Pocket Spending (%) | Medicaid Spending (%) | Other Spending (%) |
|---|---|---|---|---|---|
| Oxycodone | 28.9 | 39.0 | 14.1 | 10.2 | 7.9* |
| Hydrocodone | 12.4 | 43.9 | 28.6 | 12.6 | 2.5 |
| Tramadol | 13.1 | 49.5 | 23.9 | 10.2 | 3.3* |
Notes: *Relative standard error is greater than 30 percent. Percentages may not add to exactly 100.0 due to
rounding. The results for morphine and codeine are not shown based on Precision Standards Guidelines of
AHRQ.
Source: Center for Financing, Access, and Cost Trends, AHRQ, Household Component of the
Medical
Expenditure Panel Survey, 2021-2022
Figure 5. Average annual total and out-of-pocket expense per fill for all outpatient prescription opioids and top opioid products,^ U.S. civilian noninstitutionalized adult population, 2021-2022
| Outpatient Prescription Opioids | Average Total Payment | Average Total Out-Of-Pocket Payment |
|---|---|---|
| All Outpatient Prescription Opioids | 51 | 9 |
| Oxycodone | 99 | 14 |
| Hydrocodone | 28 | 8 |
| Tramadol | 18 | 4 |
| Morphine | 45 | 8 |
| Codeine | 16 | 6 |
Note: ^ Products containing specific opioids ranked by annual total expenses in 2021-2022.
Source: Center for Financing, Access, and Cost Trends, AHRQ, Household Component of the
Medical Expenditure Panel Survey, 2021-2022
Figure 6. Average annual total and out-of-pocket expense per person for outpatient prescription opioids, overall and by opioid product,^ U.S. civilian noninstitutionalized adult population, 2021-2022
| Outpatient Prescription Opioids | Average Total Payment | Average Total Out-Of-Pocket Payment |
|---|---|---|
| All Outpatient Prescription Opioids | 174 | 31 |
| Oxycodone | 282 | 40 |
| Hydrocodone | 85 | 24 |
| Tramadol | 53 | 13 |
| Morphine | 234 | 40 |
| Codeine | 35 | 13 |
Note: ^ Among adults with at least one opioid fill or at least one fill of the top opioid products,
respectively.
Source: Center for Financing, Access, and Cost Trends, AHRQ, Household Component of the
Medical Expenditure Panel Survey, 2021-2022
AHRQ Pub. No. 25-0017-2-EF
February 2025