Methodology Report #34:
Sample Design of the 2020 Medical Expenditure Panel Survey
Insurance Component
Karen E. Davis, MA
Table of Contents
1.0 Background
1.1 Data Collection Process Overview
1.2 Sample Design Process Overview
1.2.1 Private sector
1.2.2
State and Local Government (Public) Sector
1.2.2.1
Figure 1. 2020 MEPS-IC Sample Allocation Summary
1.3 Private Sector
1.3.1 Frame
1.4 Sample Allocation and Selection
1.4.1
Table 1. Private-Sector Non-Certainty Allocations by State,
2020
1.4.2
Table 2. Private-Sector Stratum Boundaries and Non-Certainty
Allocations, 2020
1.5 State and Local Government
1.5.1 Frame
1.5.2 Sample Allocation and Selection
1.5.2.1 Table 3. Census Division by State
1.5.2.2
Table 4. State and Local Government Allocations per Census
Division, 2020
1.6 Summary
1.7 References
Appendix A.
2020 MEPS-IC Relative Standard Error Estimation Goals
Appendix B.
Example of Revised Selection Probabilities for Two Private-Sector
Firms
Appendix C.
History of Changes to the MEPS-IC Sample Allocation
Abstract
The primary purpose of this report is to describe the data
collection, sample design, sample allocation, and sample selection
process for the 2020 MEPS Insurance Component (MEPS-IC). This
information is important for researchers using the data who wish to
understand the details of its sampling design. Following a brief
overview, both the private-sector and public (state and local
governments) sector designs are described. The details presented in
this report apply specifically to the 2020 data year, however the
appendices include a history of sample allocation changes to the
MEPS-IC.
Suggested Citation
Davis, K.
Sample Design of the 2020 Medical Expenditure Panel Survey
Insurance Component. Methodology Report #34. August 2021. Agency for Healthcare
Research and Quality, Rockville, MD.
http://www.meps.ahrq.gov/mepsweb/data_files/publications/mr34/mr34.shtml
*
*
*
The estimates in this report are based on the most recent data
available at the time the report was written. However, selected
elements of MEPS data may be revised on the basis of additional
analyses, which could result in slightly different estimates from
those shown here. Please check the MEPS Web site for the most
current file releases.
Center for Financing, Access and Cost Trends
Agency for Healthcare Research and Quality
5600 Fishers Lane, Mailstop 07W41A
Rockville, MD 20857
http://www.meps.ahrq.gov/
Return to Table of Contents
Background
The Medical Expenditure Panel Survey Insurance Component (MEPS-IC)
is an annual federal survey of employers that is a major source of
information on employer-related health insurance in the United
States. The survey is sponsored by the Agency for Healthcare
Research and Quality (AHRQ) and conducted by the U.S. Census
Bureau. It is designed to collect employment-related health
insurance information, such as whether insurance is offered and if
so, the annual premiums, enrollments, employee contributions, and
types of offered plans, deductibles, coverage and copayments.
Employer characteristics such as firm size, type of industry,
average payroll per employee, and other items are also collected.
The survey was first administered in 1997, with data collected for
the entire 1996 calendar year. Each year, a large number of tables
of estimates are published on the MEPS website for each annual
survey (http://meps.ahrq.gov/mepsweb/data_stats/quick_tables.jsp#insurance). Starting with the 2020 MEPS-IC, data will also be available in
a more flexible Tableau format. These tables provide estimates at
the national, state, and Census geographic division levels as well
as for selected metropolitan statistical areas. Data from the
MEPS-IC are only released in aggregate tabular format because of
Census confidentiality restrictions. Researchers can apply for
permission to use the restricted-access microdata at designated
Research Data Centers (RDCs). For more information about these
RDCs, see:
https://www.census.gov/about/adrm/fsrdc/locations.html
This report describes the data collection, sample design, sampling
allocation, and sample selection process for the 2020 MEPS-IC.
Necessary changes were implemented to the data collection process
in 2020 due to the health pandemic. These process adjustments are
described in the Data Collection Process Overview section. A
glossary of terms related to the MEPS-IC is available at:
http://meps.ahrq.gov/mepsweb/survey_comp/ic_ques_glossary.shtml
Return to Table of Contents
Data Collection Process Overview
The MEPS-IC survey data are collected each year from employers in
both the private sector and state and local governments using three
primary modes: telephone, mail (paper), and internet. In addition,
personal visits are used to contact some of the largest employers.
The general order of data collection operations is:
-
Phone Research
The goal of the phone research operation is to try to get the
name and contact information of the primary person who will
complete the MEPS-IC survey and determine if the business has
gone out of scope (closed, moved, etc.). This operation occurs
from April through June.
In 2020, an alternative
phone research operation was developed to account for Census
Bureau interviewers who were not telework-ready due to
COVID-19. Instead of using Bureau-issued laptops, interviewers
collected telephone numbers and relevant information in
spreadsheets.
-
Prescreener
The goal of the prescreening operation is to reach the
appropriate contact person to determine whether the employer
offered health insurance to its employees. This operation
occurs from June through August. During the prescreener, if the
employer reports not offering insurance, then characteristics
about the business are collected, the survey case is complete,
and the business is classified as a respondent. For employers
that report offering insurance, the number of plans is
collected, and then the Census Bureau mails the survey forms.
If no contact is made with the employer during the prescreener,
survey forms are mailed to the employer's location.
In 2020, by the start of the prescreener operation in June, all
interviewers had received Bureau-issued laptops and were fully
teleworking. For employers that offered health insurance,
interviewers began to also collect the contact person's email
address to facilitate and promote web response. Survey forms
were not mailed to the employer's location if no contact was
made. Instead, the nonrespondents were sent to the mail
operation described below.
-
Mail
After the survey cases leave the prescreening operation, the
mail operation begins with the mailing out of survey materials.
This operation occurs from June through October. An initial
letter, describing the purpose of the survey, along with the
survey forms are mailed to employers. The letter requests that
completed survey forms be returned within 30 days. The
employers are offered the choice of responding either by
completing the paper form and returning it by mail or
completing the survey electronically using the respondent
portal on the internet. If the employer has not responded
within 40 days, a follow-up letter and additional survey forms
are mailed.
In 2020, due to the pandemic, the Census Bureau did not have
sufficient onsite staff to conduct the mail operation. Instead
of sending the full mail package (initial letter and survey
forms), a new letter was developed and mailed to employers that
encouraged them to create an account and complete the survey
online. Secure messaging was a new method used to email the
contact person, granting them internet access using their
authentication code to complete the survey. Forms were also
mailed later in the summer.
-
Personal Visit
The goal of the personal visit operation is to contact some of
the largest nonresponding employers (those with 5,000 or more
employees) to update prior survey data. Because they are
selected into the survey every year, the point of contact has
already been established from previous surveys, and it is
already known if they offer insurance to their employees based
on their prior responses. This operation occurs from August
through December.
In 2020, due to the pandemic, there were no personal visits. In
June, a new advanced email letter with a link to the respondent
portal was developed and sent to the largest employers, and a
reminder email letter was subsequently sent in October to
encourage internet response.
-
Problem Resolution
The problem resolution (PR) operation corrects missing and
inconsistent respondent data that logical edits and other data
edits cannot resolve. PR does not occur for all missing and
incorrect data; it is conducted only in cases with failures
with key variables. This operation occurs from September
through February. Both internet responses and mail responses
are eligible for PR. During this procedure Census staff attempt
to hand-edit the data using paper forms, but if this is not
possible, they contact the respondent by telephone to resolve
the issue.
In 2020, Census staff were provided with electronic instead of
paper PR listings because staff were working from home due to
the pandemic. In addition to telephone calls, secure messaging
via email was newly used to reach respondents who may not have
been accessible by phone.
-
Telephone follow-up
The telephone follow-up (TFU) operation and problem resolution
occur simultaneously. If the employer does not respond to the
mailed survey forms, or fails to provide an internet response,
an attempt is made to administer an abbreviated version of the
survey by telephone. TFU is conducted using CATI (computer
assisted telephone interviewing) as well as using paper forms
for some larger employers.
In 2020, during the TFU operation some of the contact persons
requested that interviewers send them an email to complete the
survey. Secure messaging, which was newly available, made it
possible to use email to grant online access to the respondent
portal. There were other contact persons who requested the full
mail package. Although the mail operation had minimal staff due
to the pandemic, a limited number of packages were mailed upon
request.
Return to Table of Contents
Sample Design Process Overview
The MEPS-IC is a nationwide sample of private-sector establishments
and state and local governments. Data are collected from samples
selected from two sampling frames that, together, cover nearly all
of the employers in the United States, with the exception of the
Federal Government and the U.S. military, which are not part of the
target population. The two sampling frames are as follows:
Private-sector
The U.S. Census Bureau's Business Register (BR) is a confidential
list of private-sector establishments. The list is developed and maintained by
the Census Bureau and continually updated. It is the source
of official Census Bureau figures on the number and employment size
of establishments in the United States.
State and Local Government (Public) Sector
The frame of state and local governments for the MEPS-IC is the
Governments Master Address File (GMAF), constructed with units that
are eligible from the Census of Governments (COG) and updates from
several annual economic surveys. The COG is conducted every 5 years
by the Census Bureau and is updated continually between Census
years. For more information about the COG, see:
http://www.census.gov/econ/overview/go0100.html.
The two prongs of the survey undergo separate sample selection and
estimation processes. The combined sample consists of almost 46,000
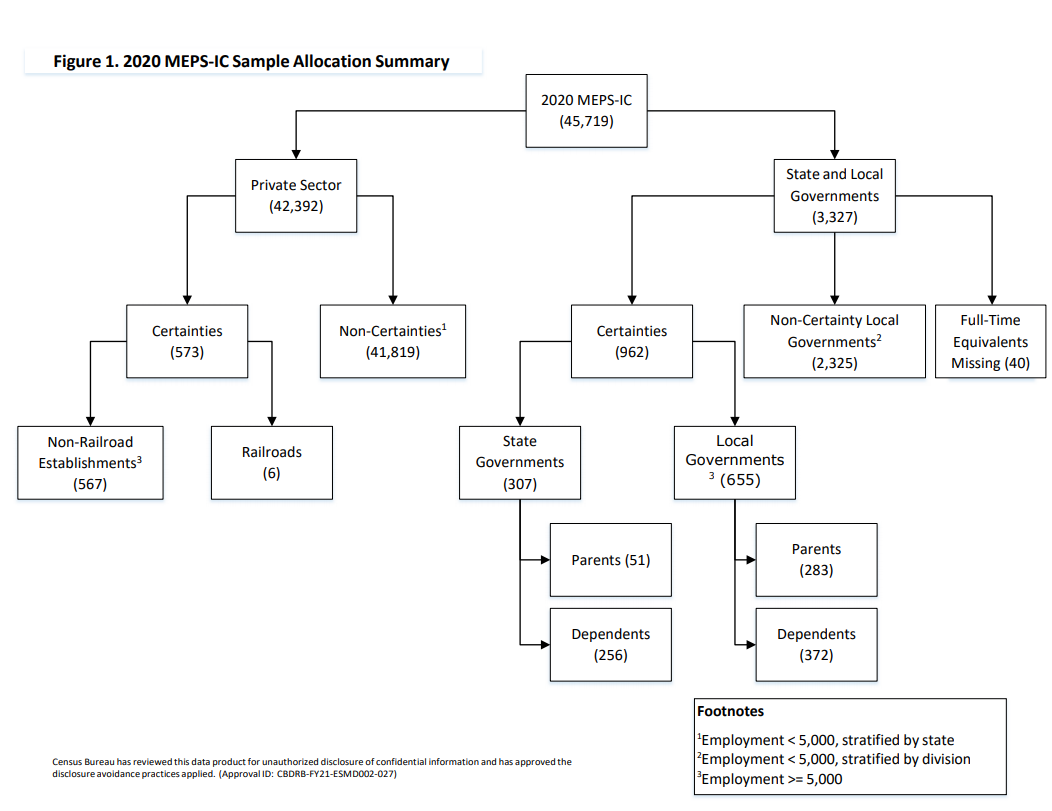
employers (see Figure 1).
The overall sampling goal for the MEPS-IC is to produce nationally
representative estimates for the private and state and local
government sectors separately and combined as well as by state for
the private sector and by Census division for state/local
governments. There were several precision goals for the 2020 MEPS
survey in terms of relative standard errors (RSE) as shown in
Appendix A. Figure 1 provides an overview of the sampling processes
and sample sizes in 2020. Subsequent sections of this report on the
private sector and the state and local government sector describe
these sampling processes in more detail.
Return to Table of Contents
Figure 1. 2020 MEPS-IC Sample Allocation Summary
Private Sector
Frame
The private-sector frame is created from the Census Bureau's BR and
is constructed each year in March, following the timing of payroll
imputation processing, which is usually not completed until
February. For the private sector, an establishment is defined as a
particular workplace or location, while a firm is a business entity
consisting of one or more business establishments under common
ownership or control. In this report, establishments within firms
that have more than one establishment are referred to as
multi-units, while other establishments are referred to as
single-units.
For the 2020 MEPS frame, a single-unit establishment was included
if its annual payroll was greater than zero in 2019, while
multi-unit establishments were included if the annual payroll was
greater than zero in 2018. Two different years were used to develop
the 2020 MEPS frame because a major change to the frame
construction occurred in 2008 when the survey switched from
retrospective (with the interview conducted in the calendar year
following the survey reference year) to current (with the interview
year the same as the survey reference year) (Kearney and Sommers,
2006). This change impacted the choice of data to use to determine
whether establishments are in scope and which data are available to
place them in strata. Consequently, the data year used for
multi-units is one year older than for single-units because
multi-unit imputation processing was not completed at the time of
frame construction. There were about 7.7 million private-sector
establishments in the United States in 2020. All large
establishments with 5,000 or more employees were selected with
certainty.
The following types of establishments on the BR are considered out
of scope: U.S. Post Offices; private households; public
administrations; insurance and employee benefit funds; trusts,
estates, and agency accounts; offices of bank holding companies;
and offices of other holding companies. They are considered out of
scope because they are not part of the target population for the
private-sector portion of the survey. Unincorporated self-employed
establishments with no employees are excluded from the MEPS-IC
frame.
Special processing occurs for railroads and single-unit agriculture
production establishments. Railroads are handled in a special way
because these data do not correspond to any one state (or site) and
are often at the firm level instead of the establishment level.
Thus, state-level data for railroads are not available on the BR.
Because of this, all railroad firms are included in the sample
(i.e., treated as certainties). In addition, the negligible number
of non-railroad establishments associated with these firms are
excluded from the frame. Single-unit agriculture production
establishments are temporarily pulled out from the MEPS frame
before the private-sector sample is drawn because there are no
edits for them on the BR. These establishments are edited
separately; known out-of-scopes are removed, and employment is
imputed if it is missing or zero using annual payroll data, average
quarterly wage factors, and other data from the Bureau of Labor
Statistics. After the editing process, these agricultural
establishments are added back to the MEPS frame in preparation for
sampling. On average, about 750 of these cases are sampled each
year.
When frame construction is complete, four panels are created where
each non-certainty establishment is randomly assigned to one of the
four panels (see Sample Allocation and Selection section below for
definition of "certainty" and "non-certainty" establishments). When
combined with the certainty establishments, each of these panels is
nationally representative. Multi-unit establishments on the prior
year's frame are assigned to the same panel as the prior year,
while single-units and new multi-unit establishments are randomly
assigned across the four panels. Each year, two of the four panels
are selected for the survey. These two panels include one new panel
and one old panel overlapping with the prior year. This strategy
helps to reduce the reporting burden for single-units by reducing
their chances of being repeatedly included across years into the
MEPS-IC sample.
Return to Table of Contents
Sample Allocation and Selection
The private-sector sample is drawn at the establishment level, not
at the firm level, so it is possible to have more than one
establishment sampled from the same firm. There is a certainty
stratum which contains establishments with employment of 5,000 or
more. All of these establishments are in the United States, and the
certainty establishments are not part of the state allocation
process for the non-certainty sample described below. Railroad
establishments are also selected with certainty into their own
stratum.
For the non-certainty establishments, the optimal national
allocation to states would be to allocate them proportionally to
the number of establishments within each state. However, for most
states this would result in far too small a sample to meet state
estimation goals. From experience with past MEPS-IC surveys, it has
been determined that a sample of approximately 500 establishments
per state yields estimates that meet most state estimation goals
using state stratification and allocation processes. To meet state
precision goals, a sample of a uniform size could be allocated to
each state. An allocation of a sample of uniform size to each state
would produce state estimates that meet state estimation goals, but
would be 50 percent less precise nationally than proportional
allocation and would not produce national estimates that meet the
precision target. Therefore, a compromise allocation was developed,
which starts by proportionally allocating about 21,000 sample
establishments (based on the assumption of an 80 percent response
rate) among the states. The allocation is then augmented for the 42
smallest states so that each of the 11 smallest states receives 495
additional sample establishments, and each of the next 31 larger
states receives 535 additional sample units. The nine largest
states are not augmented and therefore receive their entire sample
allocation from the proportional allocation of the 21,000 units.
Note that Washington, DC, is included in the state allocation. This
allocation results in sampling error for national estimates about
20 percent higher than if the entire 8 sample were proportionally
allocated. However, these estimates do meet national and state
estimation goals (appendix A).
Table 1 provides the 2020 MEPS private-sector sample allocation for
non-certainties by state. The total allocated sample size is
41,819.
Table 1. Private-Sector Non-Certainty Allocations by State,
2020*
| 726 |
400 |
| 672 |
400 |
| 726 |
350 |
| 672 |
350 |
| 1,991 |
950 |
| 726 |
400 |
| 726 |
400 |
| 672 |
300 |
| 672 |
300 |
| 1,103 |
550 |
| 726 |
350 |
| 672 |
300 |
| 672 |
400 |
| 1,463 |
700 |
| 726 |
450 |
| 726 |
450 |
| 672 |
400 |
| 726 |
350 |
| 726 |
350 |
| 672 |
400 |
| 726 |
350 |
| 726 |
350 |
| 866 |
450 |
| 726 |
400 |
| 672 |
350 |
| 813 |
450 |
| 672 |
400 |
| 672 |
450 |
| 672 |
300 |
| 672 |
400 |
| 817 |
350 |
| 672 |
350 |
| 2,292 |
950 |
| 725 |
400 |
| 672 |
400 |
| 781 |
450 |
| 726 |
400 |
| 726 |
400 |
| 1,137 |
550 |
| 672 |
350 |
| 726 |
400 |
| 672 |
450 |
| 726 |
400 |
| 1,871 |
850 |
| 726 |
400 |
| 672 |
400 |
| 726 |
400 |
| 726 |
400 |
| 672 |
400 |
| 726 |
450 |
| 672 |
400 |
| 41,819 |
22,000 |
* The Census Bureau has reviewed this data product for unauthorized
disclosure of confidential information and has approved the
disclosure avoidance practices applied. (Approval ID:
CBDRB-FY21-ESMD002-027)
† Total responding (rounded) as of April 13, 2021.
After the state sample sizes are determined, the sample is
allocated into 14 strata within each state. The 14 strata are
defined by a combination of establishment size and firm size. The
2020 MEPS strata boundaries and allocations are listed in Table 2.
Note that these stratum boundaries are evaluated periodically and
subject to slight modifications in different years.
Table 2. Private-Sector Stratum Boundaries and Non-Certainty
Allocations, 2020‡
| 1-12 |
1-4 |
6,085 |
| 5-12 |
4,844 |
| 13-91 |
1-26 |
5,222 |
| 27-91 |
4,402 |
| 92-755 |
1-18 |
1,532 |
| 19-67 |
1,666 |
| 68-142 |
1,335 |
| 143-286 |
1,179 |
| 287-755 |
768 |
| 756+ |
1-20 |
4,192 |
| 21-86 |
3,538 |
| 87-275 |
2,734 |
| 276-925 |
2,769 |
| 926-4,999 |
1,553 |
‡ The Census Bureau has reviewed this data product
for unauthorized disclosure of confidential information and has
approved the disclosure avoidance practices applied. (Approval ID:
CBDRB-FY21-ESMD002-027)
A composite of two different allocations based on the Neyman
optimal allocation formula (Cochran, 1977) is used to obtain the
state-level non-certainty allocation for the ith stratum
within each state as follows:
rsi = .01 nsi + .99 msi
The first allocation is performed as follows based on the standard
deviation calculated for the estimated percent of all
establishments that offer health insurance:
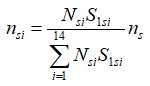
where
Nsi is the number of establishments in the ith
stratum in the sth state,
ns is the state sample size,
S1si is the standard deviation for the sth
state and the ith stratum calculated based on the
percentage of all establishments that offer health insurance, and
nsi is the allocation to the ith stratum in
the sth state.
The second allocation is performed in the same manner but using a
different key MEPS-IC estimate (total enrollees) as follows:
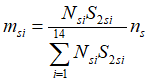
where
Nsi is the number of establishments in the ith
stratum in the sth state,
ns is the state sample size,
S2si is the standard deviation for the sth
state and the ith stratum calculated based on total
enrollees, and
msi is the allocation to the ith stratum in
the sth state.
The final allocation, rsi, is the weighted allocation
obtained by taking the weighted value of the optimal allocations
for the two variables. The weighting factors for the final
allocation (.01 and .99) were determined based on an evaluation of
the best overall balance in precision of estimates for the two
variables.
Once these allocations are completed, each establishment in a
stratification cell is given the same chance of selection equal to
psi = rsi/Nsi where rsi
is the final allocation within the state.
At this point, in order to reduce the reporting burden on large
firms—where a single respondent may sometimes be able to
provide the information for more than one establishment owned by
that firm, the probabilities are adjusted.
The values of the psi for all establishments linked to
the same firm on the frame are summed. This yields the number of
establishments that are expected to be selected for that firm. For
a small number of firms, this expected value is large and
potentially a burden for the responding firms. Moreover, since the
insurance offered to employees of establishments within very large
firms is often similar, it is more efficient to reduce the sample
within these firms to both minimize burden and increase the sample for
other establishments.
To reduce this expected number of establishments, the probabilities
of selection are reduced to a level that minimizes response burden
using adjustment factors that are based on firm size. To make up
for this reduction in sample, the probability of selection for all
other establishments in a stratification cell that contains an
establishment with a reduced probability of selection is increased
(see example in Appendix B). The increase is calculated by the
amount necessary to have the sum of the probabilities of selection
within the strata equal rsi. Once these probabilities of
selection are finalized, the allocated samples are selected using
systematic sampling. To perform this selection, the file is sorted
by state, strata, industry and number of employees. This assures a
good balance of establishments within strata.
Prior to 2007, a birth sample was included in the sample
allocation, in order to capture any newly created establishments
after the frame was constructed but prior to data collection.
However, the switch to current year data collection in 2008
eliminated the need for an annual birth sample. While the primary
focus for this report is the 2020 survey design, there have also
been other significant changes to the sampling design since 2003. A
history of the changes to the sample allocations can be found in
Appendix C.
The sample sizes for private-sector establishments, reported by
single-unit and multi-units, beginning with the 1996 survey can be
found at the following link:http://meps.ahrq.gov/mepsweb/survey_comp/ic_sample_size.jsp
In some years, slight modifications are made to the MEPS-IC to
improve various aspects of the survey. For details see Section VIII
at the following link:
http://meps.ahrq.gov/mepsweb/survey_comp/ic_technical_notes.shtml
Return to Table of Contents
State and Local Government
Frame
The frame of state and local governments for the MEPS-IC is the
GMAF, constructed with units that are eligible from the COG and
updates from several annual economic surveys. The GMAF universe is
updated continuously, although a formal and comprehensive update
occurs during the COG. The COG identifies and describes all units
of governments in the U.S., and provides benchmark figures of
public finance and public employment, including how governments are
organized, how many people they employ and payroll amounts, and the
finances of governments. The COG occurs every five years for years
ending in "2" and "7" and the 2017 COG was used for the 2020
MEPS-IC frame. There are also annual surveys, such as the Boundary
and Annexation Survey, the Annual Survey of State and Local
Government Finances, and the Annual Survey of Public Employment and
Payroll (ASPEP), which provide periodic updates to the GMAF. From
the survey/Census collection period, the data are reviewed and
edited as necessary, and the GMAF universe is updated 1.5-2 years
following initial collection cycle. A parent government is defined
as a state or local governmental entity, while dependent agencies
are associated with a parental governmental agency and includes
entities such as community colleges, libraries, school boards, etc.
The sampling unit for governments is the parent agency along with
its dependent agencies (if any). Note that starting in 2017, and
continuing for 2020, all dependent agencies were sampled for
certainty governments (see Sample Allocation and Selection section
below for definition of "certainty" governments). There were about
97,000 state and local governments in the United States in 2020.
The federal government, the U.S. military, and U.S. Post Offices
are considered out of scope for the survey.
Sample Allocation and Selection
The 2020 MEPS-IC state and local government sample consists of
three components: certainties, sampled non-certainties, and sampled
cases missing fulltime equivalent (FTE) employment data. The
certainty governments comprise the 51 state governments (including
Washington, DC) and any local government with over 5,000 employees
(655 cases in 2020). All certainty cases are assigned a base sample
weight equal to 1.0.
The non-certainty government sample covers all other governments
(except for missing FTE cases described in the last paragraph of
this section below) and is stratified by the nine Census divisions.
The divisions are defined in table 3 below.
Table 3. Census Division by State
|
Connecticut, Maine, Massachusetts, New Hampshire, Rhode Island,
Vermont
|
| New Jersey, New York, Pennsylvania |
|
Illinois, Indiana, Michigan, Ohio, Wisconsin
|
|
Iowa, Kansas, Minnesota, Missouri, Nebraska, North Dakota,
South Dakota
|
|
Delaware, District of Columbia, Florida, Georgia, Maryland,
North Carolina, South Carolina, Virginia, West Virginia
|
| Alabama, Kentucky, Mississippi, Tennessee |
| Arkansas, Louisiana, Oklahoma, Texas |
|
Arizona, Colorado, Idaho, Montana, Nevada, New Mexico, Utah,
Wyoming
|
|
Alaska, California, Hawaii, Oregon, Washington
|
A non-certainty sample size of 200 governments is allocated to each
Census division for a total of 1,800. To perform the selection
using probability proportional to size (PPS) sampling, each
government is given a measure of size equal to the square root of
its total FTE employment (which includes any dependent agency
employment). The selection probability (pij) for a single government is determined as the total final Census
division non-certainty state government allocation (i.e., 200),
times the government's measure of size, divided by the sum of all
measures of size for all governments within the Census division on
the frame.
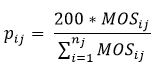
where
MOSij is the square root of the non-certainty government
FTE employment for the ith government unit in the jth
Census division,
nj is the total number of units in the jth
Census division.
The non-certainty government sample within each Census division is
selected using a systematic PPS sampling from a file sorted by
state, type of government (county, city, township, school district,
special district) within the state, and by FTE employment within
type of government. For every selected case, a base sample weight
equal to the inverse of the selection probability (p) is
assigned.
Table 4 provides the 2020 non-certainty sample allocations for the
public sector.
Table 4. State and Local Government Allocations per Census
Division, 2020§
| 200 | 299 |
| 200 | 235 |
| 200 | 217 |
| 200 | 217 |
| 200 | 337 |
| 200 | 282 |
| 200 | 250 |
| 200 | 251 |
| 200 | 237 |
| 1,800 | 2,325 |
§ The Census Bureau has reviewed this data product
for unauthorized disclosure of confidential information and has
approved the disclosure avoidance practices applied. (Approval ID:
CBDRB-FY21-ESMD002-027)
Finally, it should be noted that cases that have missing FTE
employment on the frame are placed into a separate file for
processing before the non-certainty sample is drawn. A systematic
sample of 40 cases is drawn from the cases in this file. To perform
this selection, the file is first sorted by state, type of
government, and total employees within type of government (if
available). Every sampled case determined to be in-scope is
assigned a base sample weight equal to the number of missing FTE
cases divided by 40.
Return to Table of Contents
Summary
This report described the sample design, sample allocation, and
sample selection processes for both the private-sector and state
and local governments within the MEPS-IC. This information is
important for researchers using the data who wish to understand its
sampling structure. The details presented in this report apply
specifically to the 2020 data year. Insurance Component data files
are not available for public release; however an extensive series
of published tables is available at
http://meps.ahrq.gov/mepsweb/survey_comp/Insurance.jsp.
Return to Table of Contents
References
Cochran, W.G. Sampling Techniques, 3rd Edition. 1977. John
Wiley and Sons, New York.
Davis, K.
Sample Design of the 2017 Medical Expenditure Panel Survey
Insurance Component. Methodology Report #31. July 2018. Agency for Healthcare
Research and Quality, Rockville, MD.
http://www.meps.ahrq.gov/mepsweb/data_files/publications/mr31/mr31.shtml
Kashihara D.
Construction of Weights for the 2011 Medical Expenditure Panel
Survey Insurance Component. Methodology Report #28. October 2013. Agency for Healthcare
Research and Quality, Rockville, MD.
http://www.meps.ahrq.gov/mepsweb/data_files/publications/mr28/mr28.shtml
Kearney, A., Sommers J.P. Switching from Retrospective to Current
Year Data Collection in the Medical Expenditure Panel
Survey-Insurance Component . 2006. In JSM Proceedings,
Business and Economic Statistics Section. American Statistical
Association, Alexandria, VA.
Sommers, J.P.
List Sample Design of the 1996 Medical Expenditure Panel Survey
Insurance Component
(AHCPR Pub. No. 99-0037). Methodology Report #6. 1999. Agency for
Health Care Policy and Research (AHCPR), Rockville, MD.
http://meps.ahrq.gov/mepsweb/data_files/publications/mr6/mr6.pdf
Return to Table of Contents
Appendices
Appendix A. 2020 MEPS-IC Relative Standard Error Estimation
Goals
Employer Type |
Private |
State and Local Government |
|
Level
|
National |
State |
National |
Division |
| Average Premiums |
0.0050 |
0.0300 |
0.0075 |
0.0375 |
|
Average Contributions
|
0.0150 |
0.0900 |
0.0200 |
0.1000 |
| Proportions |
0.0075 |
0.3000 |
0.0100 |
0.0500 |
Return to Table of Contents
Appendix B. Example of Revised Selection Probabilities for
Two Private-Sector Firms
| Firm |
Selection Probability |
Revised Selection Probability |
| Firm ABC |
|
|
| Establishment #1 |
0.55 |
0.34 |
| Establishment #2 |
0.75 |
0.53 |
| Establishment #3 |
0.75 |
0.53 |
| Firm DEF |
|
|
| Establishment #1 |
0.20 |
0.85 |
| Total |
2.25 |
2.25 |
Let's say Firm ABC has three establishments. If we sum the
selection probabilities in column two for the firm, it yields the
expected number of establishments to be selected (2.05) for Firm
ABC. However, two establishments may be a response burden for the
Firm. Thus we reduce the selection probabilities for all
establishments for Firm ABC, and make up for this reduction by an
increase for Firm DEF.
Return to Table of Contents
Appendix C. History of Changes to the MEPS-IC Sample
Allocation
| Year |
Changes |
| 2003 |
Private sector—The strata within each state were
redefined and a separate certainty stratum was created.
Logistic regression was used to assign establishments to
strata in order to obtain a reduction in variance.
http://meps.ahrq.gov/mepsweb/data_files/publications/mr18/mr18.shtml#WithinStates
Additional funding due to the dropping of the Household
Component-Insurance Component link sample allowed for
sufficient sample in every state for the purpose of making
state-level estimates.
Virginia purchased additional sample for their state to
support sub-state estimates. See following link for full list
of additional samples purchased by states in earlier years:
http://meps.ahrq.gov/mepsweb/survey_comp/ic_technical_notes.shtml#stateestimates
State and local governments—The nine Census
divisions were used as non-certainty strata instead of
states.
|
| 2004 |
Private sector—Within each state, allocation to
the strata was determined separately to avoid assigning to a
stratum a sample size that was larger than the number of
establishments available within that stratum.
Due
to budget restrictions, the non-certainty strata sample was
reduced across all states by approximately 4 percent.
|
| 2005 |
Private sector—The allocation was increased for
Alaska and Louisiana for this year only. A total of 770
establishments were added to the sample evenly divided
between the two states. The extra sample was allocated across
the strata that are less likely to have health insurance or
likely to contain only small businesses. |
| 2006 |
Private sector—Budget constraints required an
additional reduction of 100 establishments from the total
allocation. Also, the one-time increase in the allocation for
Alaska and Louisiana was dropped. |
| 2007 |
Due to the transition from retrospective to current year data
collection, there was no survey to collect data for 2007.
|
| 2008 |
Private sector—Allocation returned to the
original stratification method used prior to 2003, with
establishment and firm size classes used for placing
establishments into strata. The allocation at the state level
was the same as in 2006, and a majority of states had 14
strata. However, smaller states had 8 strata since the strata
in these states were collapsed due to small allocations in
1996-2002.
|
| 2009-2010 |
Private sector—All states were assigned 14
strata and the strata boundaries were redefined. |
| 2011 |
Private sector—Funding provided for an
additional 200 sample cases to be included in the overall
sample. |
| 2014 |
There was a change in method for calculating standard errors
to the Taylor Series method. |
| 2017 |
Private sector—Sampling of all certainty
establishments.
Public sector—Increase sample for an additional
700 government units, and sampling of all dependencies for
certainty governments. |
Return to Table of Contents
|
