
|
|
|
Font Size:
|
||||
|
|
|
|
||||
Health Insurance Benefits at Private Employers, Estimates from MEPS-Insurance Component: 2008-2024
Research Findings #54 | December 2025
G. Edward Miller, PhD, Patricia S. Keenan, PhD, and Anita Soni, PhD, MBA
Highlights
- In 2024, average health insurance premiums were $8,486 for single coverage, $16,931 for employee-plus-one coverage, and $24,540 for family coverage, representing increases of 3.7, 4.9 and 2.5 percent, respectively, from 2023.
- Average employee contributions in 2024 increased from the previous year by 9.1 percent for single coverage ($1,789) and 5.2 percent for employee-plus-one coverage ($4,707).
- Average deductibles for single plans increased by 8.0 percent to $2,085 and average family deductibles increased by 8.8 percent to $4,063 from 2023 to 2024.
- The offer rate, total number of enrollees and take up rates did not change significantly overall or by firm size from 2023 to 2024.
- Over the period from 2008 to 2024, offer rates declined by over 10 percentage points among small firms, from 61.6 percent in 2008 to 50.5 percent in 2024.
- From 2008 to 2024, the overall take-up rate fell by 9.7 percentage points (from 78.7 to 69.0 percent) and take-up rates fell by similar amounts in small and large firms.
Abstract
Employer-sponsored insurance (ESI) is the primary source of health insurance coverage for individuals under age 65 in the United States. This Research Findings report uses data from the 2008-2024 Medical Expenditure Panel Survey–Insurance Component to examine trends in private-sector ESI benefits, including eligibility, offers, enrollment, coverage, premiums, employee contributions, and deductibles.
Introduction
Employer-sponsored insurance (ESI) is the primary source of health insurance coverage for individuals under age 65. This Research Findings report uses data from the Medical Expenditure Panel Survey-Insurance Component (MEPS-IC) private sector national tables to describe trends in employer coverage, premiums, and deductibles from 2008 to 2024, focusing primarily on changes from 2023 to 2024. MEPS-IC is an annual survey of private employers and state and local governments and is designed to be representative of all 50 states and the District of Columbia.
This Research Findings report describes trends and patterns in ESI for private sector employees, overall and by firm size (small firms with fewer than 50 employees versus large firms with 50 or more employees). All differences discussed in the text are statistically significant at the 0.05 level. All dollar estimates are nominal (not adjusted for inflation).
Findings
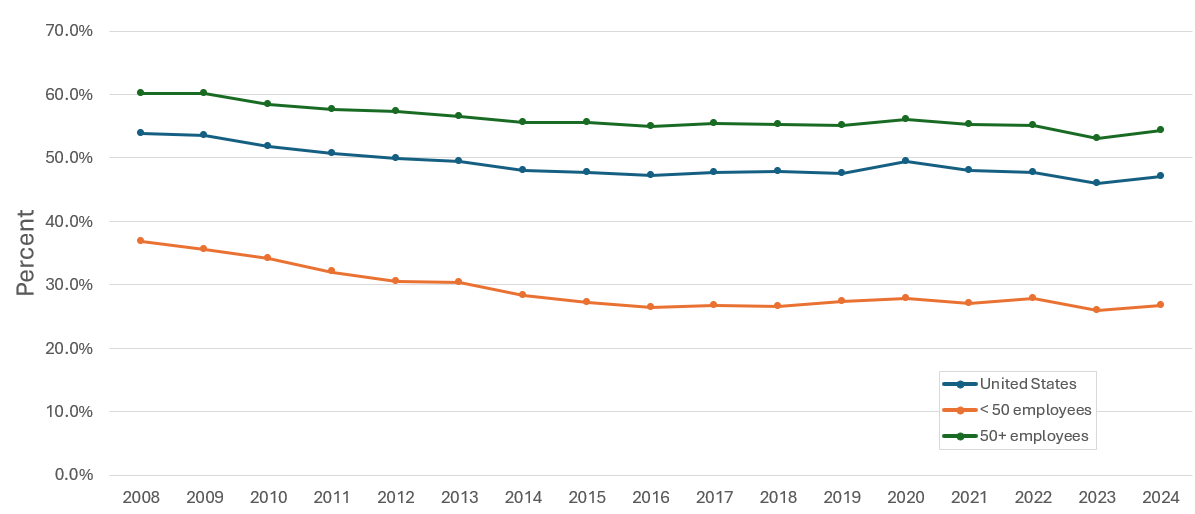
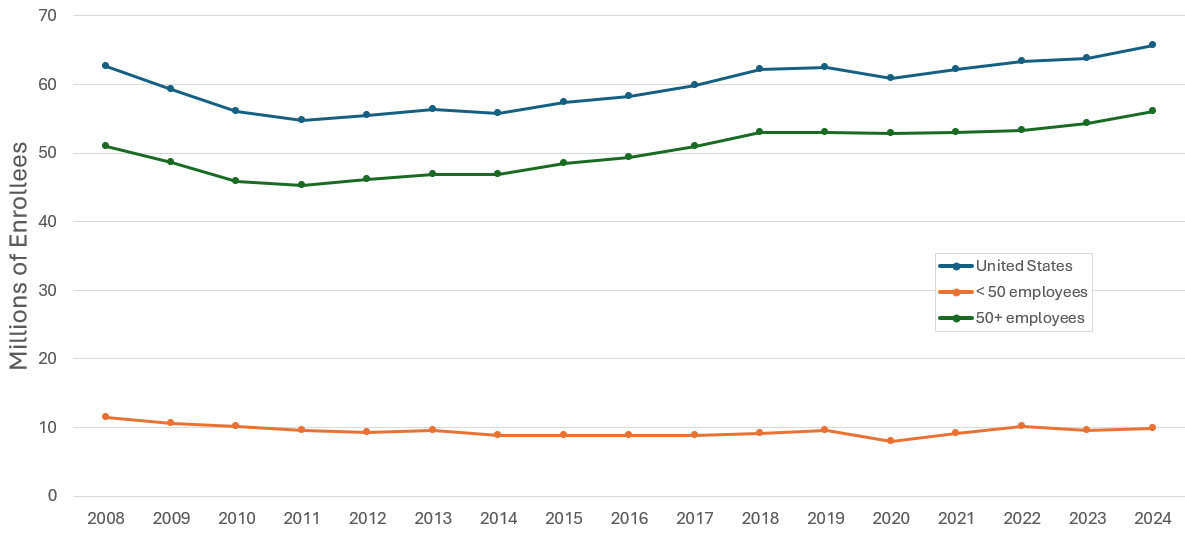
Enrollment rates and number of covered employees (figures 1-2)
The overall enrollment rate—the percentage of private sector employees covered by a health insurance plan offered by their employers—was 47.1 percent in 2024 and did not change significantly compared to 2023 (figure 1). Enrollment rates vary substantially by firm size, with 26.8 percent enrolled at small firms, compared to 54.3 percent at large firms, in 2024.
The total number of private sector workers enrolled in a health insurance plan offered by their employers was 65.6 million, with 9.8 million in firms with fewer than 50 employees and 56.0 million in large firms. There were no statistically significant changes from 2023 (figure 2).
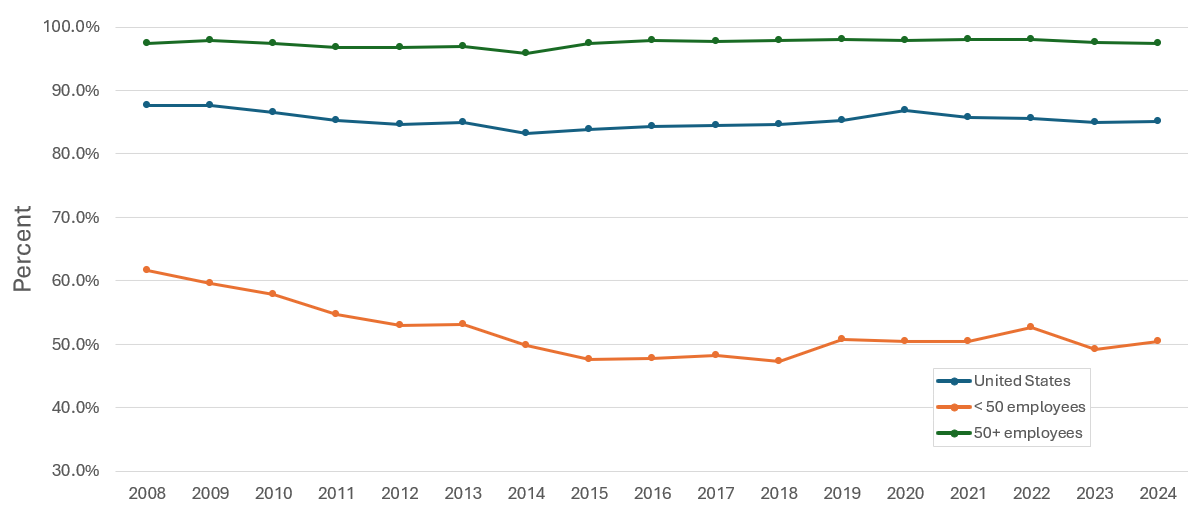
Offer rates (figure 3)
The offer rate—or the percentage of employees working at an establishment that offered insurance—did not change significantly overall or by firm size from 2023 to 2024 (figure 3). Nationally, 85.1 percent of employees worked in an establishment that offered insurance in 2024. Across all years, offer rates were lower in small firms compared to large firms. In 2024, the offer rate among small firms was 50.5 percent, compared to 97.4 percent in large firms. Over the period from 2008 to 2024, offer rates declined by over 10 percentage points among small firms, from 61.6 percent in 2008 to 50.5 percent in 2024.
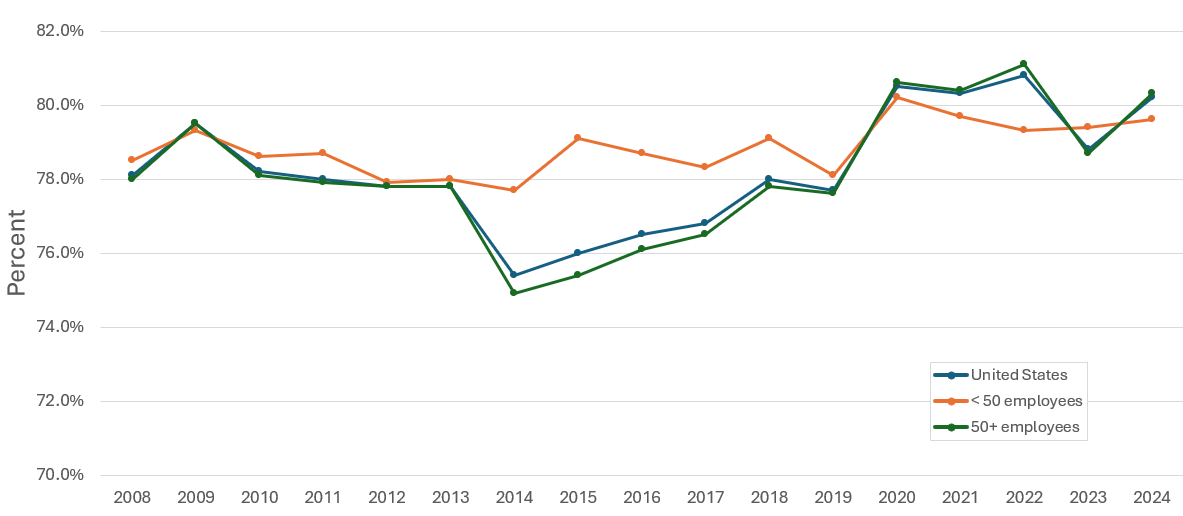
Eligibility rates (figure 4)
Overall, 80.2 percent of employees were eligible for insurance at private sector establishments that offered insurance coverage in 2024 (figure 4). These rates were not statistically different from 2023. Eligibility rates were similar for small (79.6%) and large firms (80.3%).
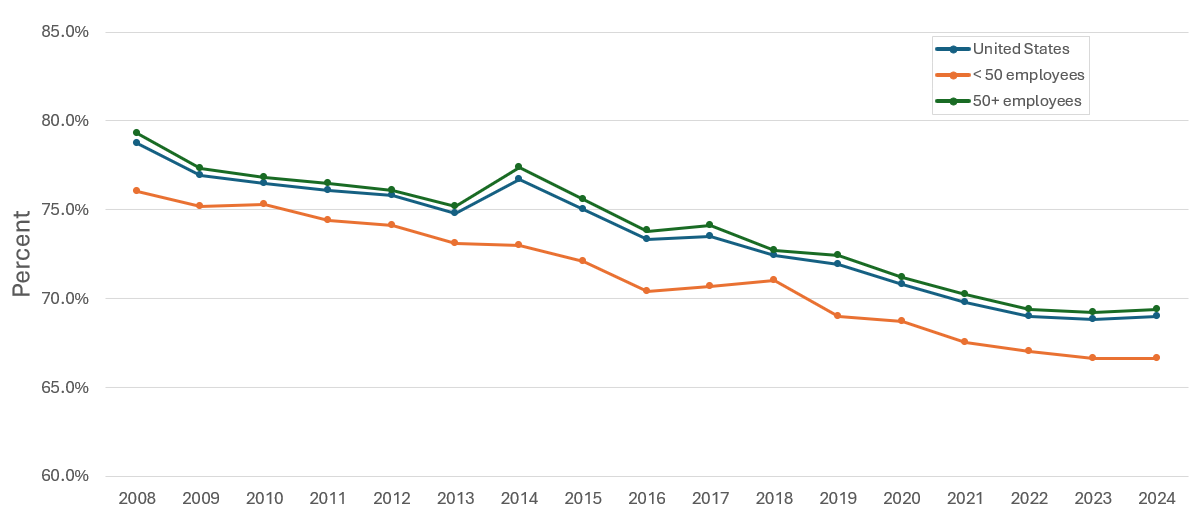
Take-up rates (figure 5)
The overall take-up rate for employees at private sector establishments who were eligible for insurance did not show a statistically significant change from 2023 (68.8%) to 2024 (69.0%) (figure 5). In 2024, the take-up rate among large firms (69.4%) remained higher than in small firms (66.6%), as has been true in every year since 2008. From 2008 to 2024, the overall take-up rate fell by 9.7 percentage points (from 78.7% to 69.0%) and take-up rates fell by similar amounts in small (9.4 percentage points) and large firms (9.9 percentage points).
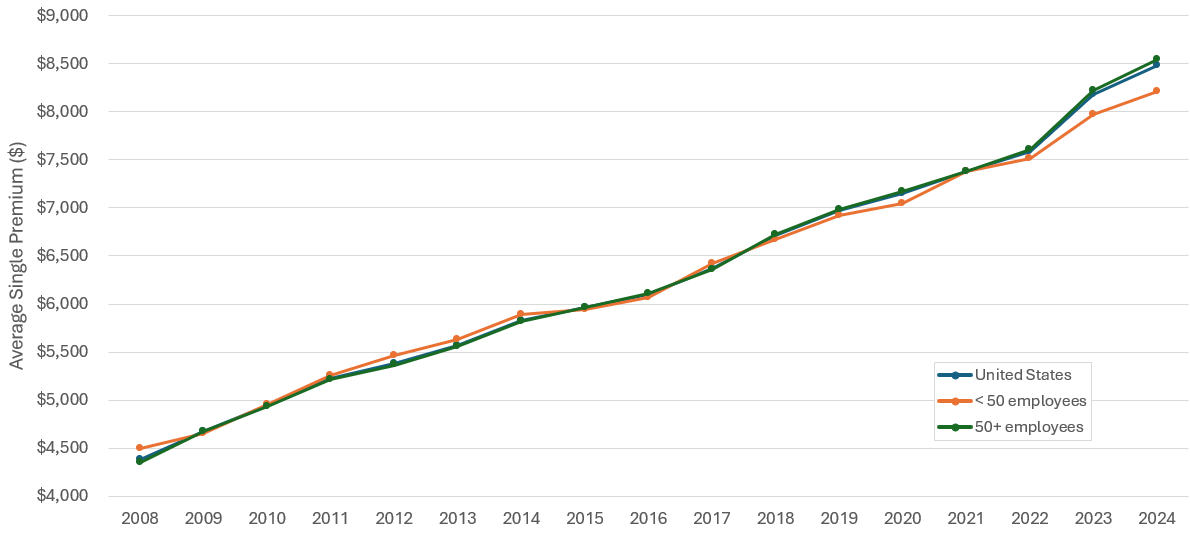
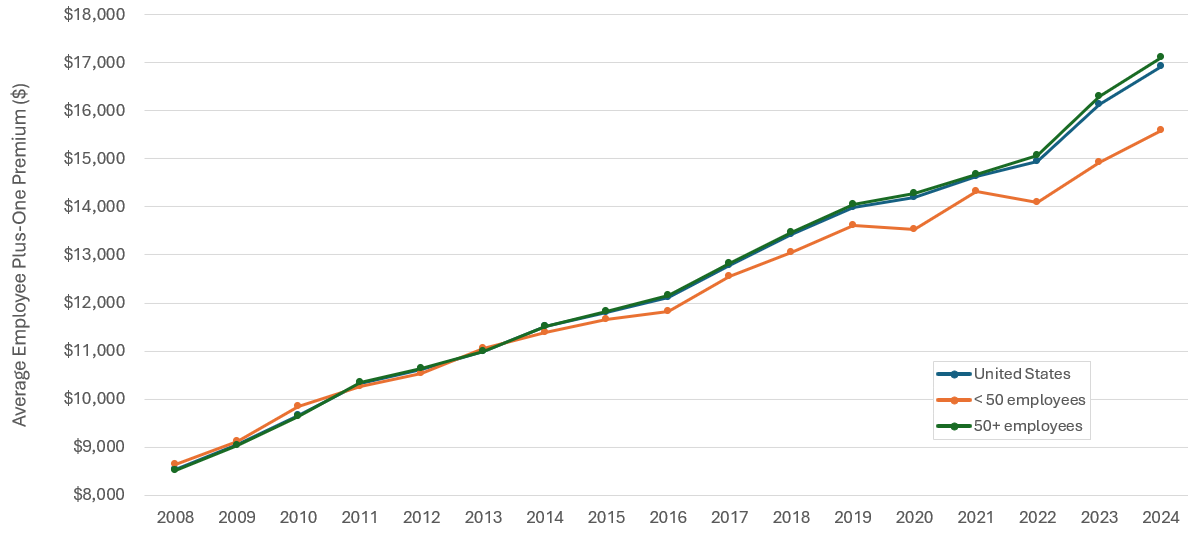
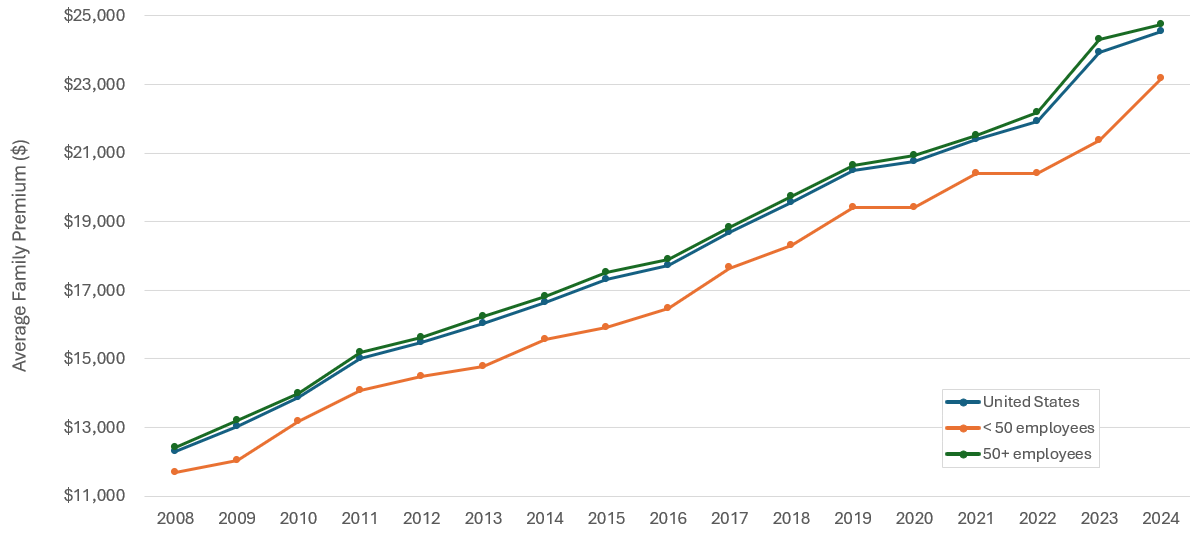
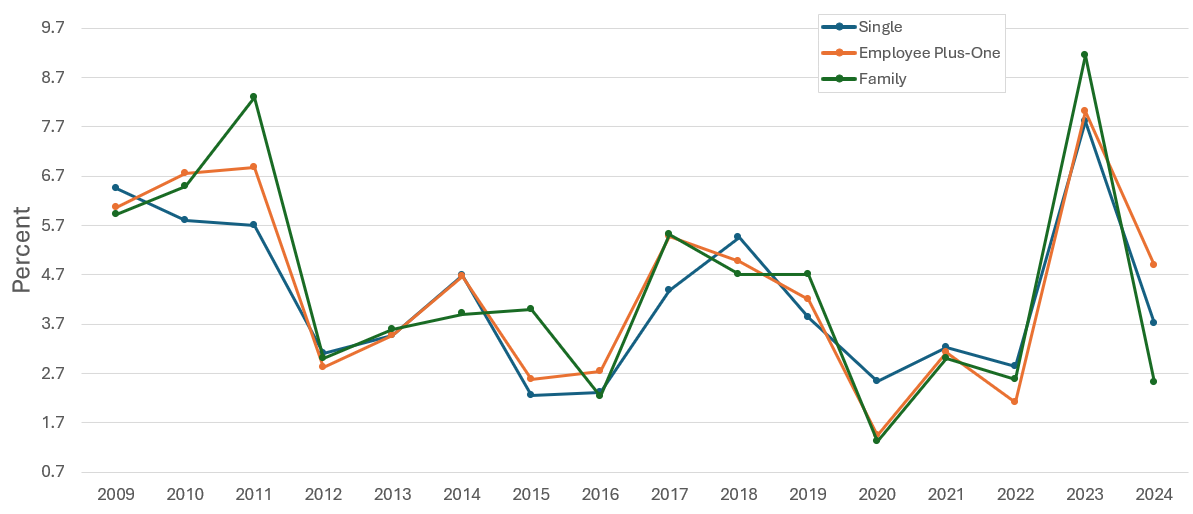
Premiums (figures 6-9)
In 2024, average health insurance premiums were $8,486 for single coverage, $16,931 for employee-plus-one coverage and $24,540 for family coverage, representing increases of 3.7, 4.9, and 2.5 percent, respectively, relative to 2023 (figures 6-9). In 2024, average premiums were lower for small firms than for large firms for single, employee-plus-one, and family coverage. Small and large firms both contributed to the overall growth in premiums for single and employee-plus-one coverage from 2023 to 2024. The overall growth in family premiums was driven by an 8.5 percent annual increase in small firm premiums.
The 2024 increases followed above average increases of 7.8, 8.0, and 9.2 percent between 2022 and 2023 for single, employee-plus-one, and family coverage, respectively. The 2022 to 2023 increases exceeded average annual growth rates from 2008 to 2024 which were 4.2, 4.4, and 4.4 percent for single, employee-plus-one, and family coverage, respectively.
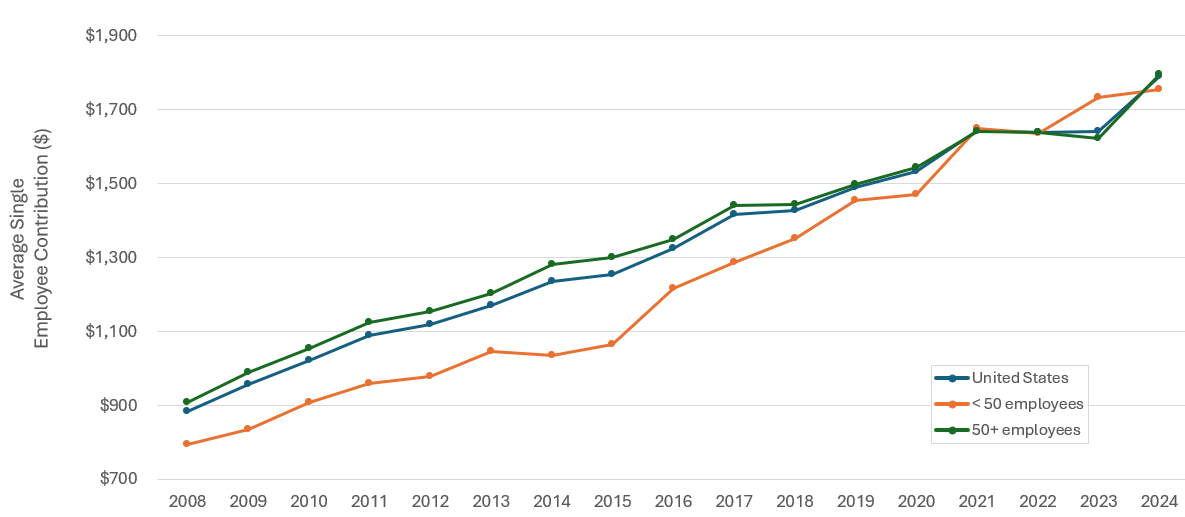
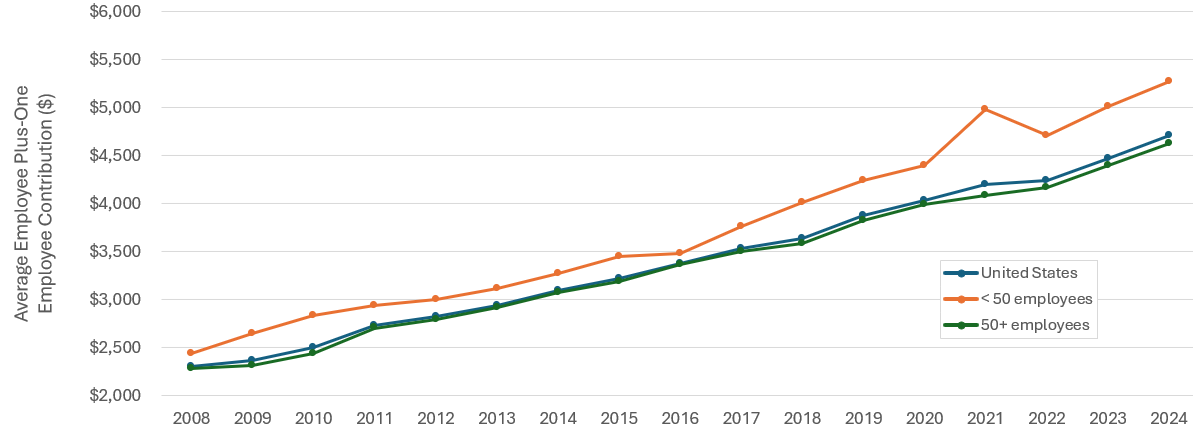
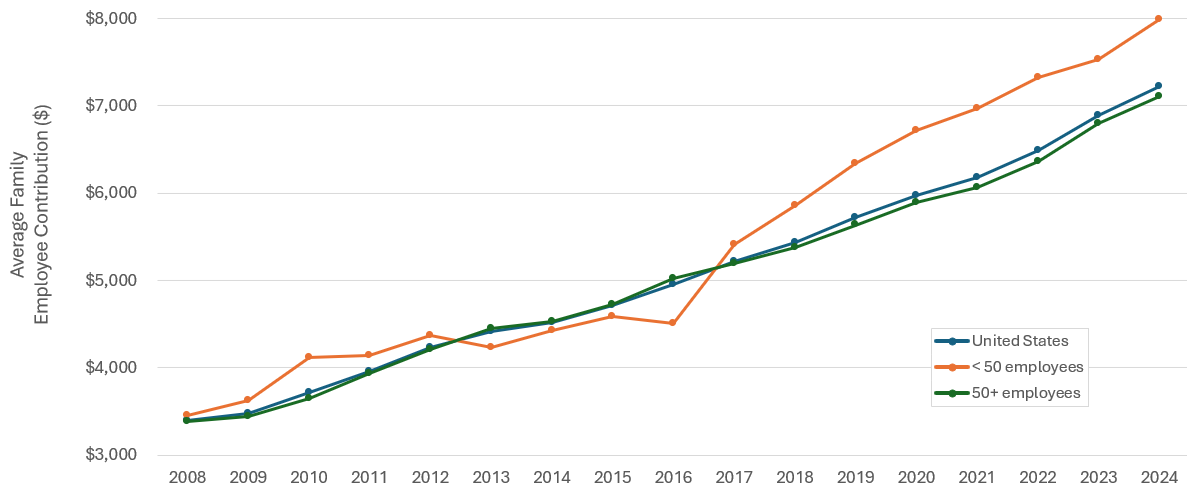
Employee premium contributions (figures 10-12)
Average employee contributions for single coverage ($1,789) and employee-plus-one ($4,707) coverage increased by 9.1 and 5.2 percent respectively, from 2023 to 2024 (Figures 10 and 11). Year-over-year growth in employee contributions for single coverage was driven by large firms, with an increase of 10.8 percent to $1,796. Employee contributions for family coverage in 2024 ($7,216) were not significantly different from 2023, overall or by firm size (Figure 12). Between 2008 and 2016, small firm employee contributions for family coverage grew at an average annual rate of 3.4 percent before beginning to increase more rapidly, with an average annual growth rate of 7.4 percent between 2016 and 2024.
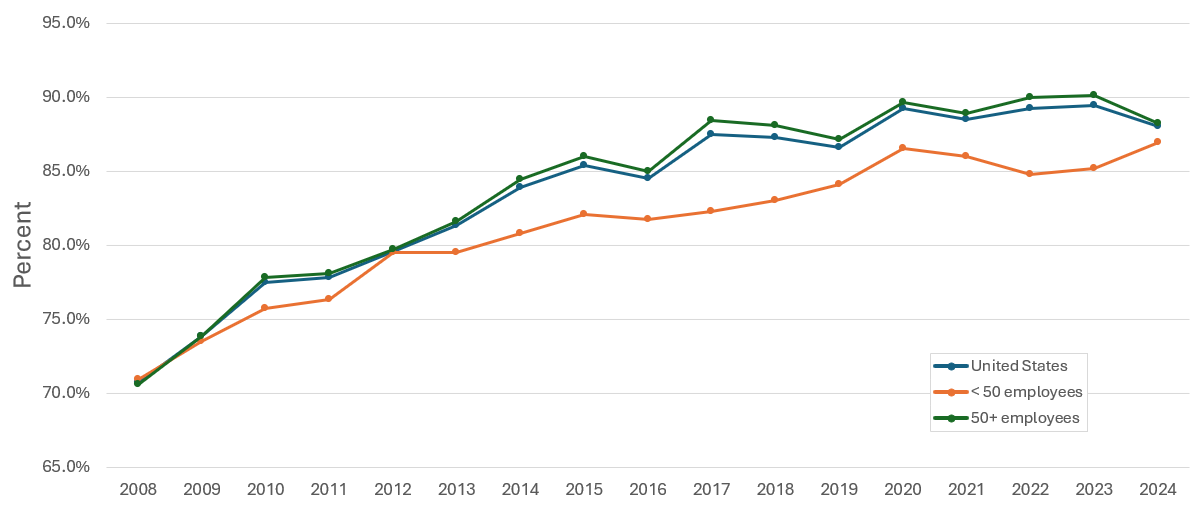
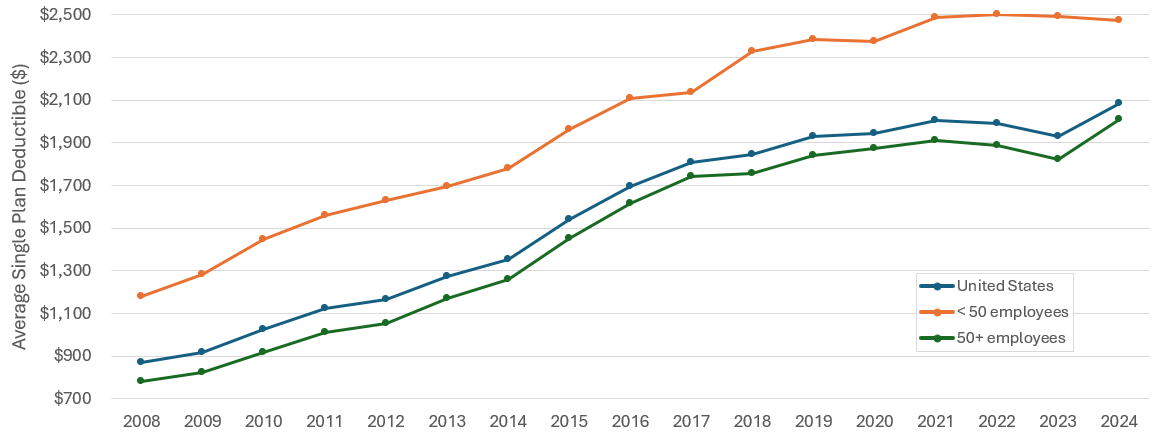
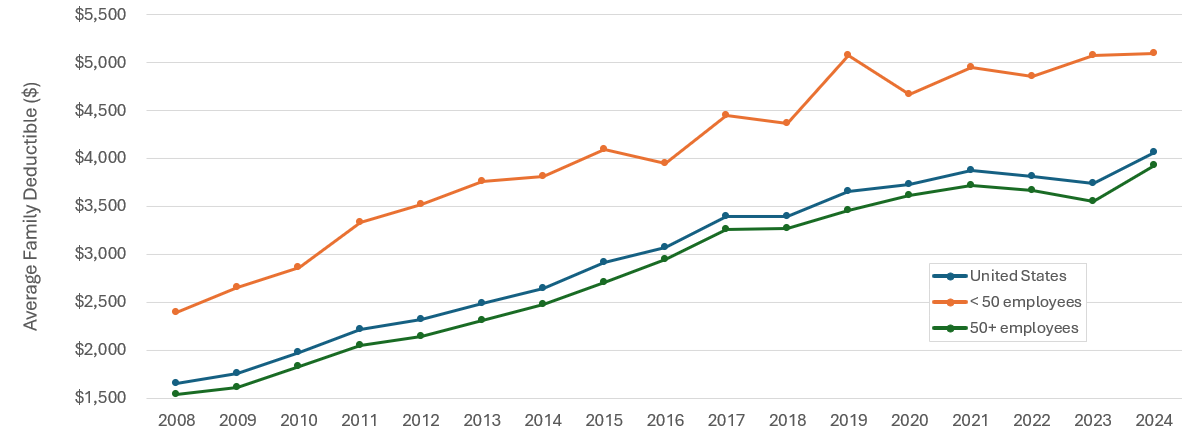
Deductibles (figures 13-15)
Compared to 2023, the percentage of enrollees in health insurance plans with deductibles in 2024 was not significantly different either for firms overall (88.0%) or for small (86.9%) or large (88.2%) firms (figure 13). From 2008 to 2024, the percentage of enrollees with a deductible increased by 16.0 percentage points among small firms and by 17.6 percentage points among large firms.
After several years of no significant changes, average single plan deductibles increased from 2023 to 2024 by 8.0 percent to $2,085, and average family deductibles increased by 8.8 percent to $4,063 (figures 14 and 15). Average single and family deductibles were higher in small than in large firms for all years 2008 to 2024. In 2024, average single deductibles were $2,474 in small firms, compared to $2,007 in large firms, and family deductibles were $5,087 in small firms, compared to $3,920 in large firms. Increases in deductibles between 2023 and 2024 were driven by large firms, with increases of 10.1 and 10.5 percent for single and family deductibles, respectively. There were no significant changes in average deductible amounts in small firms.
From 2008 to 2017, single and family deductible amounts doubled, with an average annual growth rate of 8.5 percent for single coverage and 8.3 percent for family coverage over this period. From 2017 to 2024, deductibles grew at a slower rate of 2.1 percent for single coverage and 2.6 percent for family coverage.
Definitions
Single coverage
Single coverage is health insurance that covers the employee only.
Employee-plus-one coverage
Health insurance coverage for an employee and the employee's spouse or an employee and the employee's child, at a lower premium level than family coverage. If premiums differed for employee-plus-spouse and employee-plus-child coverage, information for employee-plus-child coverage was collected.
Family coverage
A health insurance plan that covers the employee and one or more family members (spouse and/or children as defined by the plan). For the MEPS-IC survey, family coverage is any coverage other than single and employee-plus-one. Some plans offer more than one rate for family coverage, depending on family size and composition. If more than one rate is offered, survey respondents are asked to report costs for a family of four.
Enrollment rate
The enrollment rate is the percentage of all employees enrolled in their employer's health insurance at establishments both offering and not offering health insurance.
Offer rate
The offer rate is the percentage of employees who work at establishments that offer health insurance.
Eligible employees
Eligible employees are those that are allowed to enroll in employer-sponsored coverage offered by their employer. Common eligibility criteria include a minimum number of hours worked per pay period or a minimum length of service with the employer.
Employee
An employee is a person on the actual payroll. This definition excludes temporary and contract workers but includes the owner or manager if that person works at the firm.
Establishment
An establishment is a single physical location of a business.
Health insurance plan
A health insurance plan is an insurance contract that provides hospital and/or physician coverage to an employee for an agreed-upon fee (premium) for a defined benefit period.
Take-up rate
The take-up rate is the percentage of eligible employees who enroll in health insurance coverage through their employer at establishments that offer insurance.
Deductible
A deductible is a fixed dollar amount during the benefit period—usually a year—that an insured person pays before the insurer starts to make payments for covered medical services.
About MEPS-IC
The MEPS-IC is a survey of private sector business establishments and state and local governments that collects information on employer-sponsored health insurance, such as whether insurance is offered, enrollments, types of plans, and premiums. The survey is conducted annually by the U.S. Census Bureau under the sponsorship of the Agency for Healthcare Research and Quality (AHRQ). A total sample of approximately 42,519 private sector establishments was selected for the 2024 survey, with 4.6 percent of the sample determined to be out of scope during the data collection process. The response rate for the private sector was 51.2 percent of the remaining in-scope sample units. Private-sector responses to the 2024 survey were collected from May 2024 through April 2025.
Data Source
This Research Findings report summarizes data from 2008 through 2024 MEPS-IC. The data are available on the MEPS website at https://meps.ahrq.gov/survey_comp/Insurance.jsp.
References
Medical Expenditure Panel Survey Insurance Component: Technical Notes and Survey Documentation. Rockville, MD: Agency for Healthcare Research and Quality. https://meps.ahrq.gov/survey_comp/ic_technical_notes.shtml.
Davis, K. Sample Design of the 2020 Medical Expenditure Panel Survey Insurance Component. Methodology Report #34. Rockville, MD: AHRQ; August 2021. https://meps.ahrq.gov/data_files/publications/mr34/mr34.pdf.
Suggested Citation
Miller GE, Keenan PS, Soni A. Trends in Health Insurance at Private Employers, Estimates from MEPS-Insurance Component: 2008-2024. Research Findings #54. December 2025. Agency for Healthcare Research and Quality, Rockville, MD. https://meps.ahrq.gov/data_files/publications/rf54/rf54.pdf
AHRQ welcomes questions and comments from readers of this publication who are interested in obtaining more information about access, cost, use, financing, and quality of healthcare in the United States. We also invite you to tell us how you are using this Research Finding and other MEPS data and tools and to share suggestions on how MEPS products might be enhanced to further meet your needs. Please email MEPSProjectDirector@ahrq.hhs.govor send a letter to the address below:
Samuel H. Zuvekas, PhD, Acting Director
Center for Financing, Access and Cost Trends
Agency for
Healthcare Research and Quality
5600 Fishers Lane, Mailstop 07W01C
Rockville, MD 20857
Tables and Figures
Figure 1. Enrollment Rate: Percentage of all private-sector employees enrolled in employer-sponsored health insurance, overall and by firm size, 2008-2024
| United States (%) | <50 employees (%) | 50+ employees (%) | |
|---|---|---|---|
| 2008 | 53.9 | 36.8 | 60.2 |
| 2009 | 53.5 | 35.5 | 60.2 |
| 2010 | 51.8 | 34.2 | 58.4 |
| 2011 | 50.6 | 32.0 | 57.7 |
| 2012 | 49.9 | 30.5 | 57.3 |
| 2013 | 49.4 | 30.3 | 56.6 |
| 2014 | 48.1 | 28.3 | 55.6 |
| 2015 | 47.8 | 27.1 | 55.5 |
| 2016 | 47.2 | 26.5 | 54.9 |
| 2017 | 47.7 | 26.7 | 55.4 |
| 2018 | 47.8 | 26.6 | 55.3 |
| 2019 | 47.6 | 27.3 | 55.1 |
| 2020 | 49.5 | 27.8 | 56.1 |
| 2021 | 48.0 | 27.1 | 55.3 |
| 2022 | 47.7 | 27.9 | 55.2 |
| 2023 | 46.0 | 26.0 | 53.1 |
| 2024 | 47.1 | 26.8 | 54.3 |
Source: Center for Financing, Access, and Cost Trends, AHRQ, Medical Expenditure Panel Survey-Insurance Component, private-sector establishments, 2008-2024.
Figure 2. Total number (in millions) of private-sector enrollees in employer-sponsored health insurance, overall and by firm size, 2008-2024
| United States (millions) | <50 employees (millions) | 50+ employees (millions) | |
|---|---|---|---|
| 2008 | 62.6 | 11.5 | 51.0 |
| 2009 | 59.2 | 10.6 | 48.6 |
| 2010 | 56.1 | 10.2 | 45.9 |
| 2011 | 54.8 | 9.5 | 45.3 |
| 2012 | 55.4 | 9.3 | 46.1 |
| 2013 | 56.3 | 9.5 | 46.8 |
| 2014 | 55.8 | 8.9 | 46.9 |
| 2015 | 57.3 | 8.9 | 48.4 |
| 2016 | 58.2 | 8.9 | 49.3 |
| 2017 | 59.9 | 8.9 | 51.0 |
| 2018 | 62.1 | 9.1 | 53.0 |
| 2019 | 62.5 | 9.6 | 53.0 |
| 2020 | 60.8 | 7.9 | 52.8 |
| 2021 | 62.2 | 9.2 | 53.0 |
| 2022 | 63.4 | 10.1 | 53.3 |
| 2023 | 63.8 | 9.5 | 54.3 |
| 2024 | 65.6 | 9.8 | 56.0 |
Source: Center for Financing, Access, and Cost Trends, AHRQ, Medical Expenditure Panel Survey-Insurance Component, private-sector establishments, 2008-2024.
Figure 3. Offer rate: Percentage of private-sector employees in establishments that offer health insurance, overall and by firm size, 2008-2024
| United States (%) | <50 employees (%) | 50+ employees (%) | |
|---|---|---|---|
| 2008 | 87.7 | 61.6 | 97.4 |
| 2009 | 87.6 | 59.6 | 97.9 |
| 2010 | 86.5 | 57.8 | 97.4 |
| 2011 | 85.3 | 54.7 | 96.8 |
| 2012 | 84.7 | 52.9 | 96.8 |
| 2013 | 84.9 | 53.1 | 96.9 |
| 2014 | 83.2 | 49.8 | 95.8 |
| 2015 | 83.8 | 47.6 | 97.4 |
| 2016 | 84.3 | 47.7 | 97.9 |
| 2017 | 84.5 | 48.3 | 97.7 |
| 2018 | 84.6 | 47.3 | 97.9 |
| 2019 | 85.3 | 50.7 | 98.0 |
| 2020 | 86.9 | 50.5 | 97.9 |
| 2021 | 85.7 | 50.4 | 98.1 |
| 2022 | 85.6 | 52.6 | 98.0 |
| 2023 | 84.9 | 49.2 | 97.6 |
| 2024 | 85.1 | 50.5 | 97.4 |
Source: Center for Financing, Access, and Cost Trends, AHRQ, Medical Expenditure Panel Survey-Insurance Component, private-sector establishments, 2008-2024.
Figure 4. Eligibility rate: Percentage of private-sector employees eligible for health insurance at establishments that offer health insurance, overall and by firm size, 2008-2024
| United States (%) | <50 employees (%) | 50+ employees (%) | |
|---|---|---|---|
| 2008 | 78.1 | 78.5 | 78.0 |
| 2009 | 79.5 | 79.3 | 79.5 |
| 2010 | 78.2 | 78.6 | 78.1 |
| 2011 | 78.0 | 78.7 | 77.9 |
| 2012 | 77.8 | 77.9 | 77.8 |
| 2013 | 77.8 | 78.0 | 77.8 |
| 2014 | 75.4 | 77.7 | 74.9 |
| 2015 | 76.0 | 79.1 | 75.4 |
| 2016 | 76.5 | 78.7 | 76.1 |
| 2017 | 76.8 | 78.3 | 76.5 |
| 2018 | 78.0 | 79.1 | 77.8 |
| 2019 | 77.7 | 78.1 | 77.6 |
| 2020 | 80.5 | 80.2 | 80.6 |
| 2021 | 80.3 | 79.7 | 80.4 |
| 2022 | 80.8 | 79.3 | 81.1 |
| 2023 | 78.8 | 79.4 | 78.7 |
| 2024 | 80.2 | 79.6 | 80.3 |
Source: Center for Financing, Access, and Cost Trends, AHRQ, Medical Expenditure Panel Survey-Insurance Component, private-sector establishments, 2008-2024.
Figure 5. Take-up rate: Percentage of eligible private-sector employees who are enrolled in health insurance at establishments that offer health insurance, overall and by firm size, 2008-2024
| United States (%) | <50 employees (%) | 50+ employees (%) | |
|---|---|---|---|
| 2008 | 78.7 | 76.0 | 79.3 |
| 2009 | 76.9 | 75.2 | 77.3 |
| 2010 | 76.5 | 75.3 | 76.8 |
| 2011 | 76.1 | 74.4 | 76.5 |
| 2012 | 75.8 | 74.1 | 76.1 |
| 2013 | 74.8 | 73.1 | 75.2 |
| 2014 | 76.7 | 73.0 | 77.4 |
| 2015 | 75.0 | 72.1 | 75.6 |
| 2016 | 73.3 | 70.4 | 73.8 |
| 2017 | 73.5 | 70.7 | 74.1 |
| 2018 | 72.4 | 71.0 | 72.7 |
| 2019 | 71.9 | 69.0 | 72.4 |
| 2020 | 70.8 | 68.7 | 71.2 |
| 2021 | 69.8 | 67.5 | 70.2 |
| 2022 | 69.0 | 67.0 | 69.4 |
| 2023 | 68.8 | 66.6 | 69.2 |
| 2024 | 69.0 | 66.6 | 69.4 |
Source: Center for Financing, Access, and Cost Trends, AHRQ, Medical Expenditure Panel Survey-Insurance Component, private-sector establishments, 2008-2024.
Figure 6. Average total single premium per enrolled private-sector employee, overall and by firm size, 2008-2024
| United States ($) | <50 employees ($) | 50+ employees ($) | |
|---|---|---|---|
| 2008 | 4,386 | 4,501 | 4,354 |
| 2009 | 4,669 | 4,652 | 4,674 |
| 2010 | 4,940 | 4,956 | 4,935 |
| 2011 | 5,222 | 5,258 | 5,213 |
| 2012 | 5,384 | 5,460 | 5,365 |
| 2013 | 5,571 | 5,628 | 5,556 |
| 2014 | 5,832 | 5,886 | 5,819 |
| 2015 | 5,963 | 5,947 | 5,967 |
| 2016 | 6,101 | 6,070 | 6,108 |
| 2017 | 6,368 | 6,421 | 6,357 |
| 2018 | 6,715 | 6,667 | 6,725 |
| 2019 | 6,972 | 6,920 | 6,983 |
| 2020 | 7,149 | 7,045 | 7,167 |
| 2021 | 7,380 | 7,382 | 7,380 |
| 2022 | 7,590 | 7,513 | 7,607 |
| 2023 | 8,182 | 7,974 | 8,223 |
| 2024 | 8,486 | 8,215 | 8,540 |
Source: Center for Financing, Access, and Cost Trends, AHRQ, Medical Expenditure Panel Survey-Insurance Component, private-sector establishments, 2008-2024.
Figure 7. Average total employee plus-one premium per enrolled private-sector employee, overall and by firm size, 2008-2024
| United States ($) | <50 employees ($) | 50+ employees ($) | |
|---|---|---|---|
| 2008 | 8,535 | 8,631 | 8,519 |
| 2009 | 9,053 | 9,124 | 9,042 |
| 2010 | 9,664 | 9,850 | 9,635 |
| 2011 | 10,329 | 10,253 | 10,341 |
| 2012 | 10,621 | 10,524 | 10,636 |
| 2013 | 10,990 | 11,050 | 10,982 |
| 2014 | 11,503 | 11,386 | 11,519 |
| 2015 | 11,800 | 11,666 | 11,817 |
| 2016 | 12,124 | 11,833 | 12,166 |
| 2017 | 12,789 | 12,558 | 12,818 |
| 2018 | 13,425 | 13,044 | 13,475 |
| 2019 | 13,989 | 13,619 | 14,044 |
| 2020 | 14,191 | 13,522 | 14,271 |
| 2021 | 14,634 | 14,326 | 14,677 |
| 2022 | 14,943 | 14,093 | 15,066 |
| 2023 | 16,141 | 14,917 | 16,303 |
| 2024 | 16,931 | 15,583 | 17,116 |
Source: Center for Financing, Access, and Cost Trends, AHRQ, Medical Expenditure Panel Survey-Insurance Component, private-sector establishments, 2008-2024.
Figure 8. Average total family premium per enrolled private-sector employee, overall and by firm size, 2008-2024
| United States ($) | <50 employees ($) | 50+ employees ($) | |
|---|---|---|---|
| 2008 | 12,298 | 11,679 | 12,408 |
| 2009 | 13,027 | 12,041 | 13,210 |
| 2010 | 13,871 | 13,170 | 13,999 |
| 2011 | 15,022 | 14,086 | 15,175 |
| 2012 | 15,473 | 14,496 | 15,626 |
| 2013 | 16,029 | 14,787 | 16,224 |
| 2014 | 16,655 | 15,575 | 16,824 |
| 2015 | 17,322 | 15,919 | 17,524 |
| 2016 | 17,710 | 16,471 | 17,893 |
| 2017 | 18,687 | 17,649 | 18,839 |
| 2018 | 19,565 | 18,296 | 19,743 |
| 2019 | 20,486 | 19,417 | 20,645 |
| 2020 | 20,758 | 19,416 | 20,923 |
| 2021 | 21,381 | 20,406 | 21,523 |
| 2022 | 21,931 | 20,406 | 22,166 |
| 2023 | 23,938 | 21,351 | 24,312 |
| 2024 | 24,540 | 23,170 | 24,734 |
Source: Center for Financing, Access, and Cost Trends, AHRQ, Medical Expenditure Panel Survey-Insurance Component, private-sector establishments, 2008-2024.
Figure 9. Percentage change in total premiums (from previous year) per enrolled private-sector employee for single, employee-plus-one, and family coverage, 2009-2024 1
| Single (%) | Employee Plus-One (%) | Family (%) | |
|---|---|---|---|
| 2009 | 6.5 | 6.1 | 5.9 |
| 2010 | 5.8 | 6.7 | 6.5 |
| 2011 | 5.7 | 6.9 | 8.3 |
| 2012 | 3.1 | 2.8 | 3.0 |
| 2013 | 3.5 | 3.5 | 3.6 |
| 2014 | 4.7 | 4.7 | 3.9 |
| 2015 | 2.2 | 2.6 | 4.0 |
| 2016 | 2.3 | 2.7 | 2.2 |
| 2017 | 4.4 | 5.5 | 5.5 |
| 2018 | 5.4 | 5.0 | 4.7 |
| 2019 | 3.8 | 4.2 | 4.7 |
| 2020 | 2.5 | 1.4 | 1.3 |
| 2021 | 3.2 | 3.1 | 3.0 |
| 2022 | 2.8 | 2.1 | 2.6 |
| 2023 | 7.8 | 8.0 | 9.2 |
| 2024 | 3.7 | 4.9 | 2.5 |
Source: Center for Financing, Access, and Cost Trends, AHRQ, Medical Expenditure Panel Survey-Insurance Component, private-sector establishments, 2008-2024.
1 Estimates of the percent increases in premium were not available for 2008 because MEPS IC data were not collected in 2007.
Figure 10. Average annual employee contribution for single coverage, overall and by firm size, 2008-2024
| United States ($) | <50 employees ($) | 50+ employees ($) | |
|---|---|---|---|
| 2008 | 882 | 794 | 907 |
| 2009 | 957 | 834 | 989 |
| 2010 | 1,021 | 907 | 1,053 |
| 2011 | 1,090 | 960 | 1,124 |
| 2012 | 1,118 | 979 | 1,153 |
| 2013 | 1,170 | 1,045 | 1,203 |
| 2014 | 1,234 | 1,035 | 1,280 |
| 2015 | 1,255 | 1,065 | 1,299 |
| 2016 | 1,325 | 1,216 | 1,348 |
| 2017 | 1,415 | 1,287 | 1,441 |
| 2018 | 1,427 | 1,351 | 1,443 |
| 2019 | 1,489 | 1,454 | 1,497 |
| 2020 | 1,532 | 1,469 | 1,543 |
| 2021 | 1,643 | 1,650 | 1,641 |
| 2022 | 1,637 | 1,635 | 1,637 |
| 2023 | 1,640 | 1,734 | 1,621 |
| 2024 | 1,789 | 1,755 | 1,796 |
Source: Center for Financing, Access, and Cost Trends, AHRQ, Medical Expenditure Panel Survey-Insurance Component, private-sector establishments, 2008-2024.
Figure 11. Average annual employee contribution for employee plus-one coverage, overall and by firm size, 2008-2024
| United States ($) | <50 employees ($) | 50+ employees ($) | |
|---|---|---|---|
| 2008 | 2,303 | 2,442 | 2,281 |
| 2009 | 2,363 | 2,648 | 2,318 |
| 2010 | 2,498 | 2,836 | 2,444 |
| 2011 | 2,736 | 2,942 | 2,705 |
| 2012 | 2,824 | 3,004 | 2,797 |
| 2013 | 2,940 | 3,117 | 2,916 |
| 2014 | 3,097 | 3,275 | 3,073 |
| 2015 | 3,220 | 3,454 | 3,190 |
| 2016 | 3,376 | 3,479 | 3,362 |
| 2017 | 3,531 | 3,760 | 3,503 |
| 2018 | 3,634 | 4,017 | 3,584 |
| 2019 | 3,881 | 4,244 | 3,827 |
| 2020 | 4,035 | 4,398 | 3,992 |
| 2021 | 4,199 | 4,984 | 4,090 |
| 2022 | 4,237 | 4,711 | 4,169 |
| 2023 | 4,473 | 5,010 | 4,402 |
| 2024 | 4,707 | 5,274 | 4,629 |
Source: Center for Financing, Access, and Cost Trends, AHRQ, Medical Expenditure Panel Survey-Insurance Component, private-sector establishments, 2008-2024.
Figure 12. Average annual employee contribution for family coverage, overall and by firm size, 2008-2024
| United States ($) | <50 employees ($) | 50+ employees ($) | |
|---|---|---|---|
| 2008 | 3,394 | 3,458 | 3,383 |
| 2009 | 3,474 | 3,630 | 3,445 |
| 2010 | 3,721 | 4,117 | 3,649 |
| 2011 | 3,962 | 4,144 | 3,933 |
| 2012 | 4,236 | 4,366 | 4,215 |
| 2013 | 4,421 | 4,228 | 4,451 |
| 2014 | 4,518 | 4,426 | 4,532 |
| 2015 | 4,710 | 4,587 | 4,728 |
| 2016 | 4,956 | 4,510 | 5,022 |
| 2017 | 5,218 | 5,413 | 5,190 |
| 2018 | 5,431 | 5,854 | 5,372 |
| 2019 | 5,726 | 6,341 | 5,635 |
| 2020 | 5,978 | 6,714 | 5,887 |
| 2021 | 6,174 | 6,967 | 6,059 |
| 2022 | 6,492 | 7,324 | 6,364 |
| 2023 | 6,889 | 7,529 | 6,796 |
| 2024 | 7,216 | 7,984 | 7,107 |
Source: Center for Financing, Access, and Cost Trends, AHRQ, Medical Expenditure Panel Survey-Insurance Component, private-sector establishments, 2008-2024.
Figure 13. Percentage of private-sector enrolled employees in a health insurance plan with a deductible, overall and by firm size, 2008-2024
| United States (%) | <50 employees (%) | 50+ employees (%) | |
|---|---|---|---|
| 2008 | 70.7 | 70.9 | 70.6 |
| 2009 | 73.8 | 73.5 | 73.8 |
| 2010 | 77.5 | 75.7 | 77.8 |
| 2011 | 77.8 | 76.3 | 78.1 |
| 2012 | 79.6 | 79.5 | 79.7 |
| 2013 | 81.3 | 79.5 | 81.6 |
| 2014 | 83.9 | 80.8 | 84.4 |
| 2015 | 85.4 | 82.1 | 86.0 |
| 2016 | 84.5 | 81.7 | 85.0 |
| 2017 | 87.5 | 82.3 | 88.4 |
| 2018 | 87.3 | 83.0 | 88.1 |
| 2019 | 86.6 | 84.1 | 87.1 |
| 2020 | 89.2 | 86.5 | 89.6 |
| 2021 | 88.5 | 86.0 | 88.9 |
| 2022 | 89.2 | 84.8 | 90.0 |
| 2023 | 89.4 | 85.2 | 90.1 |
| 2024 | 88.0 | 86.9 | 88.2 |
Source: Center for Financing, Access, and Cost Trends, AHRQ, Medical Expenditure Panel Survey-Insurance Component, private-sector establishments, 2008-2024.
Figure 14. Average deductible per private-sector employee with single coverage in a health insurance plan with a deductible, overall and by firm size, 2008-2024
| United States ($) | <50 employees ($) | 50+ employees ($) | |
|---|---|---|---|
| 2008 | 869 | 1,177 | 782 |
| 2009 | 917 | 1,283 | 822 |
| 2010 | 1,025 | 1,447 | 917 |
| 2011 | 1,123 | 1,561 | 1,010 |
| 2012 | 1,167 | 1,628 | 1,051 |
| 2013 | 1,273 | 1,695 | 1,169 |
| 2014 | 1,353 | 1,777 | 1,259 |
| 2015 | 1,541 | 1,964 | 1,451 |
| 2016 | 1,696 | 2,105 | 1,615 |
| 2017 | 1,808 | 2,136 | 1,743 |
| 2018 | 1,846 | 2,327 | 1,754 |
| 2019 | 1,931 | 2,386 | 1,839 |
| 2020 | 1,945 | 2,376 | 1,873 |
| 2021 | 2,004 | 2,485 | 1,911 |
| 2022 | 1,992 | 2,499 | 1,887 |
| 2023 | 1,930 | 2,493 | 1,823 |
| 2024 | 2,085 | 2,474 | 2,007 |
Source: Center for Financing, Access, and Cost Trends, AHRQ, Medical Expenditure Panel Survey-Insurance Component, private-sector establishments, 2008-2024.
Figure 15. Average deductible per private-sector enrollee in family coverage with a deductible, overall and by firm size, 2008-2024
| United States ($) | <50 employees ($) | 50+ employees ($) | |
|---|---|---|---|
| 2008 | 1,658 | 2,389 | 1,535 |
| 2009 | 1,761 | 2,652 | 1,610 |
| 2010 | 1,975 | 2,857 | 1,827 |
| 2011 | 2,220 | 3,329 | 2,052 |
| 2012 | 2,322 | 3,515 | 2,142 |
| 2013 | 2,491 | 3,761 | 2,307 |
| 2014 | 2,640 | 3,810 | 2,476 |
| 2015 | 2,915 | 4,090 | 2,704 |
| 2016 | 3,069 | 3,940 | 2,944 |
| 2017 | 3,396 | 4,447 | 3,254 |
| 2018 | 3,392 | 4,364 | 3,263 |
| 2019 | 3,655 | 5,067 | 3,452 |
| 2020 | 3,722 | 4,666 | 3,609 |
| 2021 | 3,868 | 4,945 | 3,717 |
| 2022 | 3,811 | 4,854 | 3,660 |
| 2023 | 3,733 | 5,074 | 3,547 |
| 2024 | 4,063 | 5,087 | 3,920 |
Source: Center for Financing, Access, and Cost Trends, AHRQ, Medical Expenditure Panel Survey-Insurance Component, private-sector establishments, 2008-2024.
AHRQ Pub. No. 26-0003
December 2025