Skip to main content

|
|||||||||||||||
|
|
|||||||||||||||
STATISTICAL BRIEF #535:
|
|||||||||||||||
| June 2021 | |||||||||||||||
|
Rebecca Ahrnsbrak and Marie N. Stagnitti, MPA
|
|||||||||||||||
Highlights
|
|||||||||||||||
IntroductionFrom 2013 to 2018, the percentage of youths aged 12 to 17 that experienced at least one major depressive episode in the past year increased from 10.7 percent to 14.4 percent, and the percentage of adults experiencing at least one past-year major depressive episode increased from 6.7 percent to 7.2 percent. In 2018, an estimated 11.8 percent of adults aged 65 or older experienced any mental illness in the past year. Among adult females, both the percentage experiencing at least one major depressive episode in the past year and the percentage experiencing serious mental illness in the past year increased from 2013 to 2018 (8.1 percent to 9.0 percent and 4.9 percent to 5.7 percent, respectively). The percentage of Black non-Hispanic adults experiencing at least one major depressive episode in the past year also increased, from 4.6 percent in 2013 to 6.1 percent in 2018. The percentage of adults living in middle- or high-income families experiencing any mental illness in the past year increased from 16.0 percent in 2013 to 17.2 percent in 2018.[1]Prescription antidepressants and antipsychotics are two types of drug therapies sometimes prescribed to treat mental illnesses. As more people use prescription antidepressants and antipsychotics for treatment, it is important for policymakers and researchers to understand who is receiving these medications to ensure fair and equitable access to care. This Statistical Brief presents a comparison of the total number of people in the U.S. civilian noninstitutionalized population purchasing one or more antidepressant or antipsychotic prescriptions by select sociodemographic characteristics between 2013 and 2018. Estimates are based on the 2013 Medical Expenditure Panel Survey-Household Component (MEPS-HC) and the 2018 MEPS-HC. Estimates are presented separately for antidepressants and antipsychotics. Only prescriptions obtained in an outpatient setting (retail and mail-order prescribed medicines) are included in these estimates. Prescription medicines administered in an inpatient setting or in a clinic or physician's office are excluded. All differences between estimates discussed in the text are statistically significant at the 0.05 level unless otherwise noted. |
|||||||||||||||
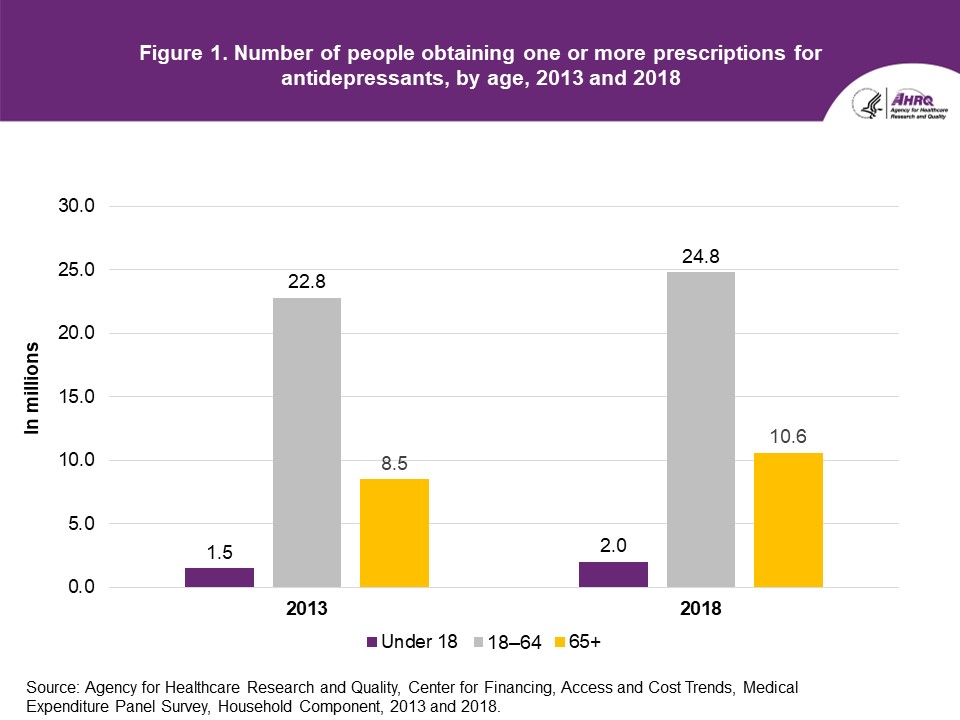
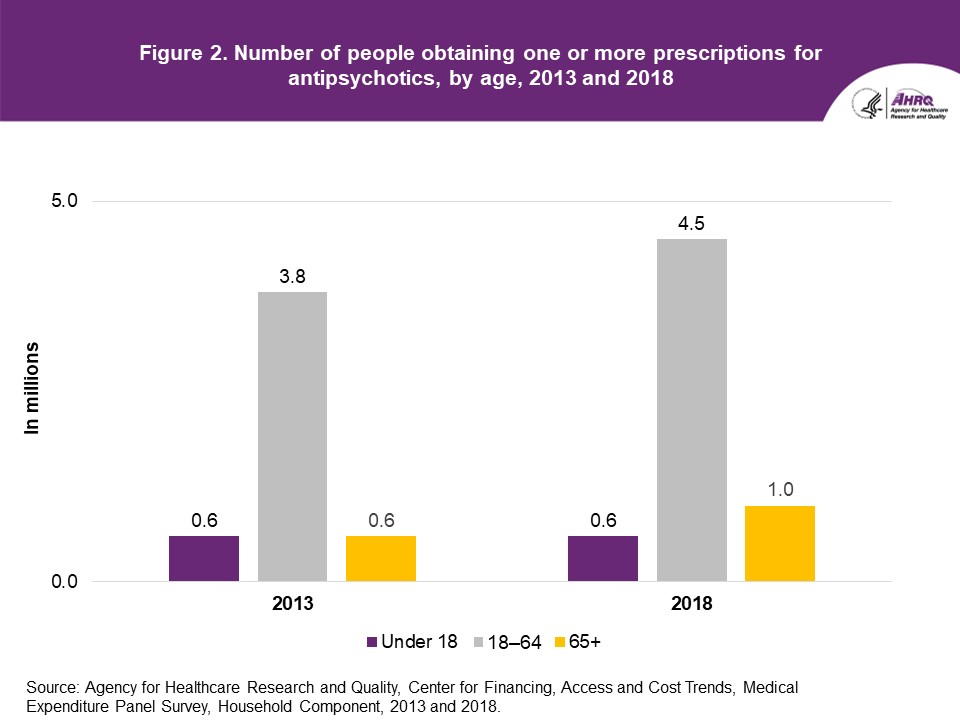
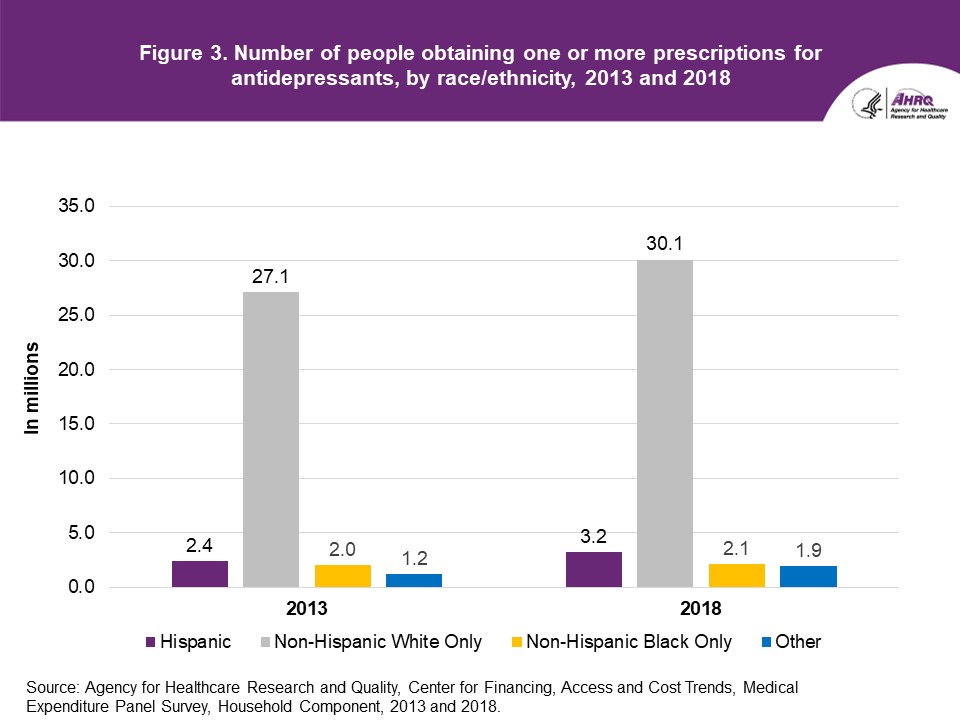
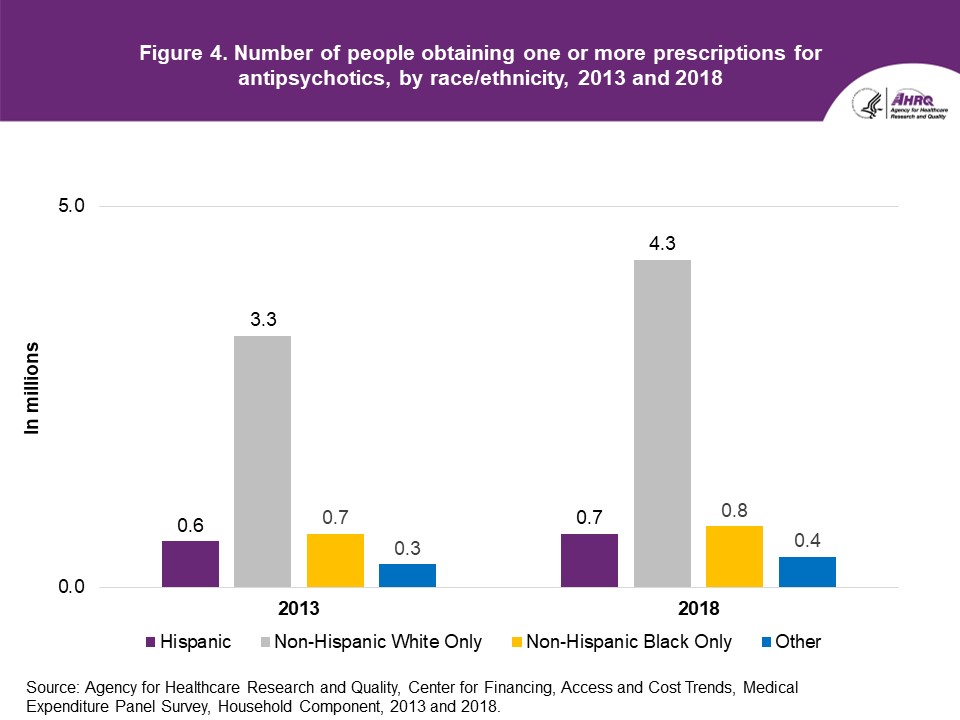
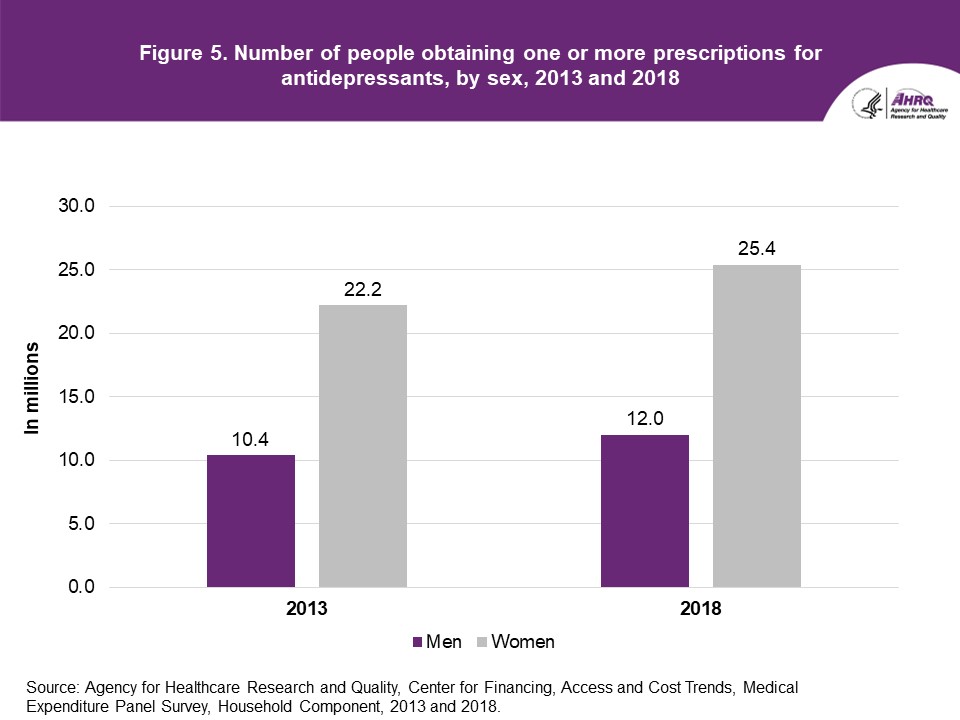
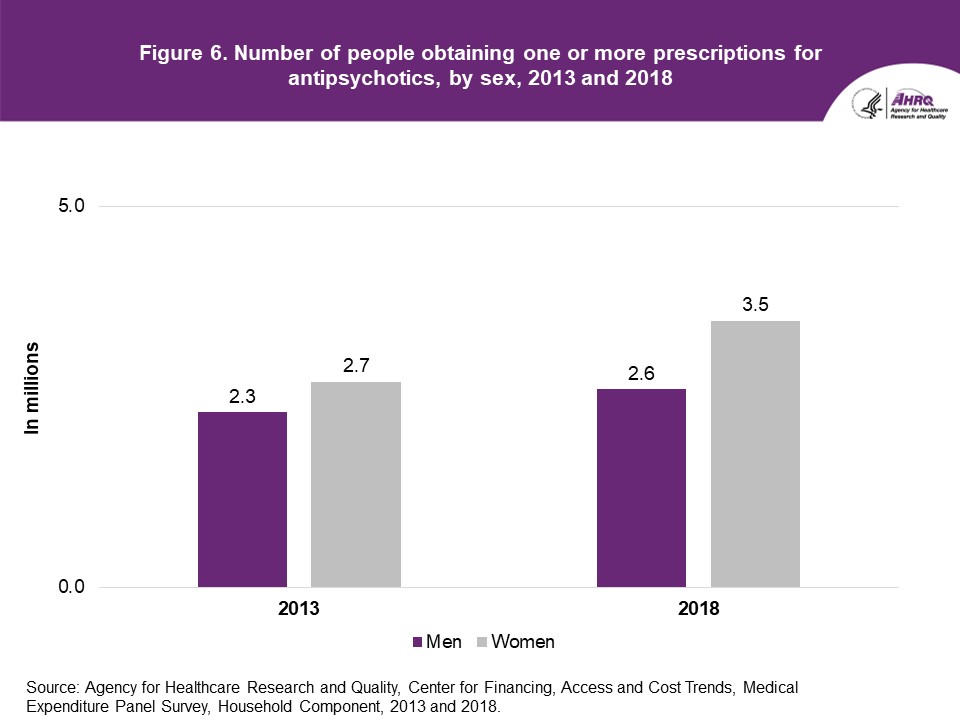
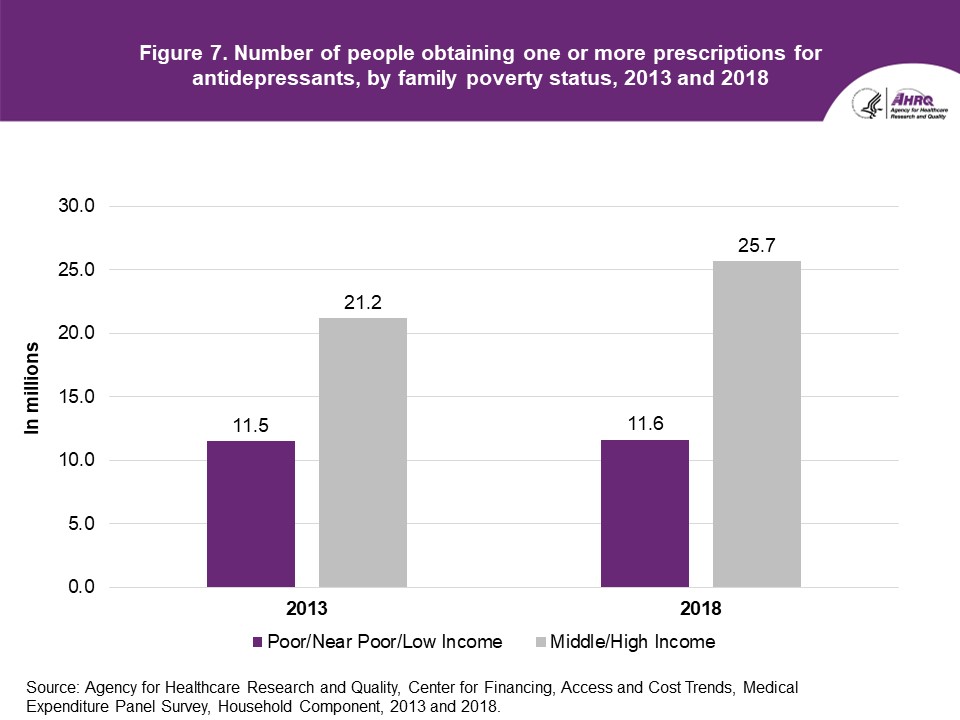
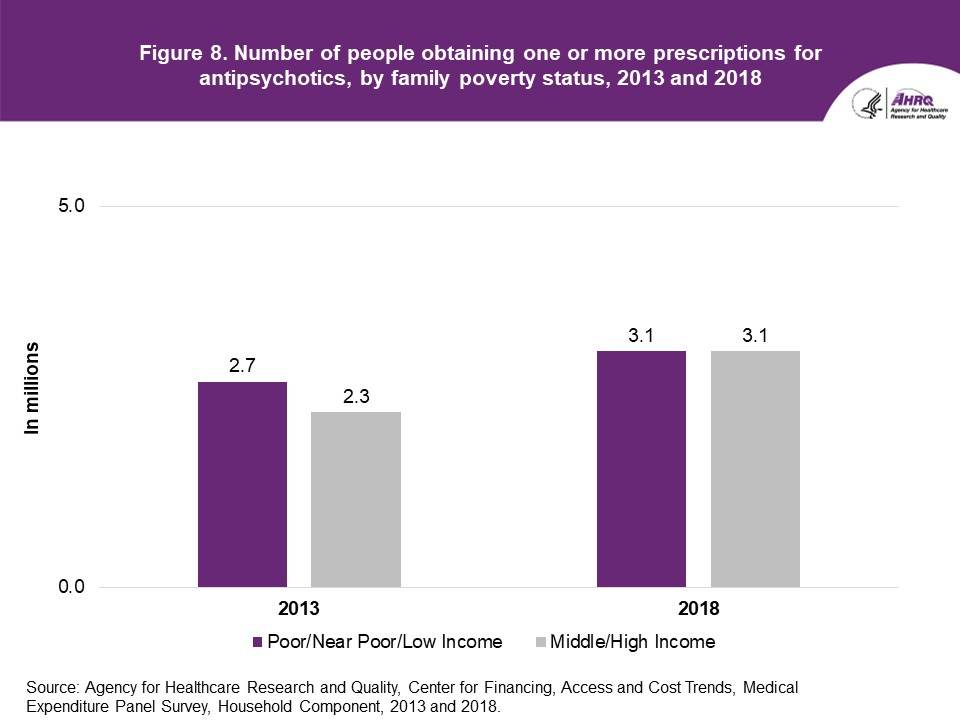
FindingsPrevious estimates of the total number of people obtaining at least one antidepressant prescription have shown that this population increased from 32.7 million in 2013 to 37.3 million in 2018[2]. Those estimates also indicated that the total number of people obtaining at least one antipsychotic prescription increased from 5.0 million in 2013 to 6.1 million in 2018[3]. This Statistical Brief provides breakouts of the total number of people obtaining at least one antidepressant prescription and the total number of people obtaining at least one antipsychotic prescription by select sociodemographic characteristics in 2013 and 2018.Age (figures 1 and 2) From 2013 to 2018, the number of elderly (age 65 and older) people obtaining at least one antidepressant prescription increased (8.5 million and 10.6 million; see figure 1), as did the number of elderly obtaining at least one antipsychotic prescription (0.6 million and 1.0 million, respectively) (figure 2). For children (age 17 and younger), an increase was only seen for antidepressants (1.5 million to 2.0 million; see figure 1). Race and Ethnicity (figures 3 and 4) Between 2013 and 2018, changes in the number of non-Hispanic White and Black people who filled or refilled at least one antidepressant prescription between the two years were not statistically significant (figure 3). However, the number of people obtaining at least one antidepressant prescription increased from 2.4 million to 3.2 million for Hispanic persons and from 1.2 million to 1.9 million for other, non-Hispanic persons. For antipsychotics, the number of White persons obtaining at least one prescription increased from 3.3 million to 4.3 million (figure 4). Sex (figures 5 and 6) Between 2013 and 2018, the number of women purchasing one or more antidepressants (22.2 million versus 25.4 million; see figure 5) and antipsychotics (2.7 million versus 3.5 million; see figure 6) increased; however, for men an increase was statistically significant only for antidepressants (10.4 million versus 12.0 million) (figure 5). Poverty Status (figures 7 and 8) Between 2013 and 2018, there were increases in the numbers of people in middle-/high-income families purchasing one or more antidepressants (21.2 million to 25.7 million; see figure 7) and antipsychotics (2.3 million to 3.1 million; see figure 8). For people in poor/near-poor/low-income families, the number of people purchasing one or more prescription antipsychotics and antidepressants did not change between 2013 and 2018. |
|||||||||||||||
Data SourceThe estimates reported in this Brief are based on data from the following Medical Expenditure Panel Survey (MEPS) data files:
The files used for this analysis are confidential internal versions (available to outside researchers through the Agency for Healthcare Research and Quality Data Center). MEPS public use files are downloadable from https://meps.ahrq.gov/data_stats/download_data_files.jsp. |
|||||||||||||||
DefinitionsAge Age is the last available age for the sampled person. For most persons, this was their age at the end of the year. Racial and ethnic classifications Classification by race/ethnicity was based on information reported for each family member. Respondents were asked if each family member's race was best described as White, Black or African American, American Indian or Alaska Native, Asian Indian, Chinese, Filipino, Japanese, Korean, Vietnamese, Other Asian, Native Hawaiian Guamanian or Chamorro, Samoan, Other Pacific Islander, or some other race. They also were asked if each family member was Hispanic, Latino, or of Spanish origin. All persons who were reported to be Hispanic were classified as such regardless of their race(s). Since the Hispanic grouping can include multiple races, the race categories of non-Hispanic Black only, non-Hispanic White only, and other do not include Hispanics. MEPS respondents who reported other single or multiple races and were non-Hispanic were included in the other category. Poverty status Income was classified based on the percentage of the federal poverty level for total family income, adjusted for family size and composition. A two-category income variable was used for this Statistical Brief: poor/near poor/low income (less than 200 percent of the federal poverty level) and middle income/high income (200 percent and greater of the federal poverty level). Purchases Utilization was defined as purchasing or obtaining a prescription in the year of interest (referred to as purchases in the Statistical Brief). Refills as well as original prescriptions are included in utilization estimates. Therapeutic classifications Therapeutic class and subclass were assigned to MEPS prescribed medicines using Multum Lexicon variables from Cerner Multum, Inc. MEPS prescribed medicines files were linked to the Multum Lexicon database to obtain therapeutic class and subclass variables. The following was used to define antidepressants in 2013 and 2018—therapeutic class: psychotherapeutic agents; subclass: antidepressants. For this analysis, antipsychotics include antimanics for both 2013 and 2018. The definitions of antipsychotics differ between the two years to account for changes in the Multum therapeutic classification system. In 2013, antipsychotics were classified by Multum as therapeutic class: psychotherapeutic agents; subclass: antipsychotics. In 2013, antimanics were classified by Multum in the miscellaneous antipsychotics sub-subclass under the antipsychotics subclass. By 2018, the Multum classification system had changed, and antimanics became an independent subclass. To account for this change, in 2018, antipsychotics were defined as therapeutic class: psychotherapeutic agents; subclasses: antipsychotics or antimanics. A prescribed medicine can be assigned multiple therapeutic classes and subclasses. The estimates presented in this Brief include all prescribed medicines assigned to the therapeutic subclass of antidepressant or antipsychotic, regardless of whether that prescribed medicine has other possible therapeutic class or subclass assignments. For example, bupropion is included in estimates of antidepressants despite also being assigned to the Multum therapeutic class of miscellaneous agents and therapeutic subclass of smoking cessation aids. For additional information on these and other Multum Lexicon variables, please refer to the Multum website. When looking at estimates over time for therapeutic subclass and sub-subclasses, it is important to keep this in mind. |
|||||||||||||||
About MEPS-HCThe Medical Expenditure Panel Survey Household Component (MEPS-HC) collects nationally representative data on healthcare use, expenditures, sources of payment, and insurance coverage for the U.S. civilian noninstitutionalized population. The MEPS-HC is cosponsored by the Agency for Healthcare Research and Quality (AHRQ) and the National Center for Health Statistics (NCHS). More information about the MEPS-HC can be found on the MEPS website at https://www.meps.ahrq.gov/. |
|||||||||||||||
ReferencesFor a detailed description of the MEPS-HC survey design, sample design, and methods used to minimize sources of nonsampling error, see the following publications:Agency for Healthcare Research and Quality. Using Appropriate Price Indices for Analyses of Health Care Expenditures or Income across Multiple Years. 2018. Agency for Healthcare Research and Quality, Rockville, MD. http://www.meps.ahrq.gov/mepsweb/about_meps/Price_Index.shtml Ahrnsbrak, R., and Stagnitti, M. N. Comparison of Antidepressant and Antipsychotic Utilization and Expenditures in the U.S. Civilian Noninstitutionalized Population, 2013 and 2018. Statistical Brief #534. December 2020. Agency for Healthcare Research and Quality, Rockville, MD Cohen, J. Design and Methods of the Medical Expenditure Panel Survey Household Component. MEPS Methodology Report No. 1. AHCPR Pub. No. 97-0026. 1997. Agency for Health Care Policy and Research (AHCPR), Rockville, MD. http://www.meps.ahrq.gov/mepsweb/data_files/publications/mr1/mr1.shtml Cohen, S. Design Strategies and Innovations in the Medical Expenditure Panel Survey. July 2003. Medical Care, 41(7) Supplement, III-5–III-12. Cohen, S. B. Sample Design of the 1996 Medical Expenditure Panel Survey Household Component. MEPS Methodology Report No. 2. AHCPR Pub. No. 97-0027. 1997. Agency for Health Care Policy and Research (AHCPR), Rockville, MD. http://www.meps.ahrq.gov/mepsweb/data_files/publications/mr2/mr2.shtml Ezzati-Rice, T. M., Rohde, F., and Greenblatt, J. Sample Design of the Medical Expenditure Panel Survey Household Component, 1998–2007. Methodology Report #22. March 2008. Agency for Healthcare Research and Quality, Rockville, MD. http://www.meps.ahrq.gov/mepsweb/data_files/publications/mr22/mr22.shtml Hill, S. C., Roemer, M., and Stagnitti, M. N. Outpatient Prescription Drugs: Data Collection and Editing in the 2011 Medical Expenditure Panel Survey. Methodology Report #29. March 2014. Agency for Healthcare Research and Quality, Rockville, MD. http://www.meps.ahrq.gov/mepsweb/data_files/publications/mr29/mr29.shtml Hill, S. C., Zuvekas, S. H., and Zodet, M. W. The Validity of Reported Medicare Part D Enrollment in the Medical Expenditure Panel Survey. December 2012. Medical Research and Review, 69(6), 737–750. Sing, M., Banthin, J. S., Selden, T. M., Cowan, C. A., and Keehan, S. P. Reconciling Medical Expenditure Estimates from the MEPS and NHEA, 2002. Fall 2006. Health Care Financing Review, 28(1), 25–40. https://www.cms.gov/HealthCareFinancingReview/downloads/06Fallpg25.pdf Stagnitti, M. N., Beauregard, K., and Solis, A. Design, Methods, and Field Results of the Medical Expenditure Panel Survey Medical Provider Component (MEPS MPC)—2006 Calendar Year Data. Methodology Report #23. November 2008. Agency for Healthcare Research and Quality, Rockville, MD. http://www.meps.ahrq.gov/mepsweb/data_files/publications/mr23/mr23.shtml |
|||||||||||||||
Suggested CitationAhrnsbrak, R., and Stagnitti, M. N. Comparison of the Total Number of People in the U.S. Civilian Noninstitutionalized Population Purchasing One or More Antidepressant and Antipsychotic Prescriptions by Select Sociodemographic Characteristics, 2013 and 2018. Statistical Brief #535. June 2021. Agency for Healthcare Research and Quality, Rockville, MD. https://meps.ahrq.gov/data_files/publications/st535/stat535.shtmlAHRQ welcomes questions and comments from readers of this publication who are interested in obtaining more information about access, cost, use, financing, and quality of healthcare in the United States. We also invite you to tell us how you are using this Statistical Brief and other MEPS data and tools and to share suggestions on how MEPS products might be enhanced to further meet your needs. Please email us at MEPSProjectDirector@ahrq.hhs.gov or send a letter to the address below: Joel W. Cohen, PhD, Director Center for Financing, Access and Cost Trends Agency for Healthcare Research and Quality 5600 Fishers Lane, Mailstop 07W41A Rockville, MD 20857 |
|||||||||||||||
|
[1] Substance Abuse and Mental Health Services Administration. (2019). Results from the 2018 National Survey on Drug Use and Health: Detailed tables. Rockville, MD: Center for Behavioral Health Statistics and Quality, Substance Abuse and Mental Health Services Administration. https://www.samhsa.gov/data/report/2018-nsduh-detailed-tables [2] Totals in Statistical Brief #534 and this Statistical Brief may not match due to rounding. [3] Ahrnsbrak, R., and Stagnitti, M. N. Comparison of Antidepressant and Antipsychotic Utilization and Expenditures in the U.S. Civilian Noninstitutionalized Population, 2013 and 2018. Statistical Brief #534. December 2020. Agency for Healthcare Research and Quality, Rockville, MD. |
|||||||||||||||
|
|||||||||||||||
Source: Agency for Healthcare Research and Quality, Center
for Financing, Access and Cost Trends, Medical Expenditure
Panel Survey, Household Component, 2013 and 2018. |
|||||||||||||||
|
|||||||||||||||
Source: Agency for Healthcare Research and Quality, Center
for Financing, Access and Cost Trends, Medical Expenditure
Panel Survey, Household Component, 2013 and 2018. |
|||||||||||||||
|
|||||||||||||||
Source: Agency for Healthcare Research and Quality, Center
for Financing, Access and Cost Trends, Medical Expenditure
Panel Survey, Household Component, 2013 and 2018. |
|||||||||||||||
|
|||||||||||||||
Source: Agency for Healthcare Research and Quality, Center
for Financing, Access and Cost Trends, Medical Expenditure
Panel Survey, Household Component, 2013 and 2018. |
|||||||||||||||
|
|||||||||||||||
Source: Agency for Healthcare Research and Quality, Center
for Financing, Access and Cost Trends, Medical Expenditure
Panel Survey, Household Component, 2013 and 2018. |
|||||||||||||||
|
|||||||||||||||
Source: Agency for Healthcare Research and Quality, Center
for Financing, Access and Cost Trends, Medical Expenditure
Panel Survey, Household Component, 2013 and 2018. |
|||||||||||||||
|
|||||||||||||||
Source: Agency for Healthcare Research and Quality, Center
for Financing, Access and Cost Trends, Medical Expenditure
Panel Survey, Household Component, 2013 and 2018. |
|||||||||||||||
|
|||||||||||||||
Source: Agency for Healthcare Research and Quality, Center
for Financing, Access and Cost Trends, Medical Expenditure
Panel Survey, Household Component, 2013 and 2018. |
| ||||||||||||||