
|
|
Font Size:
|
||||
|
|
|
|
||||
Lack of Reliable Transportation for Daily Living Among Adults: United States, 2021
Statistical Brief #558 | November 2024 | Xue Wu, PhD and Sandra L. Decker, PhD
Highlights
- About 6 percent of U.S. adults reported that lack of reliable transportation had kept them from medical appointments, meetings, or work, or from getting things needed for daily living, in the past 12 months.
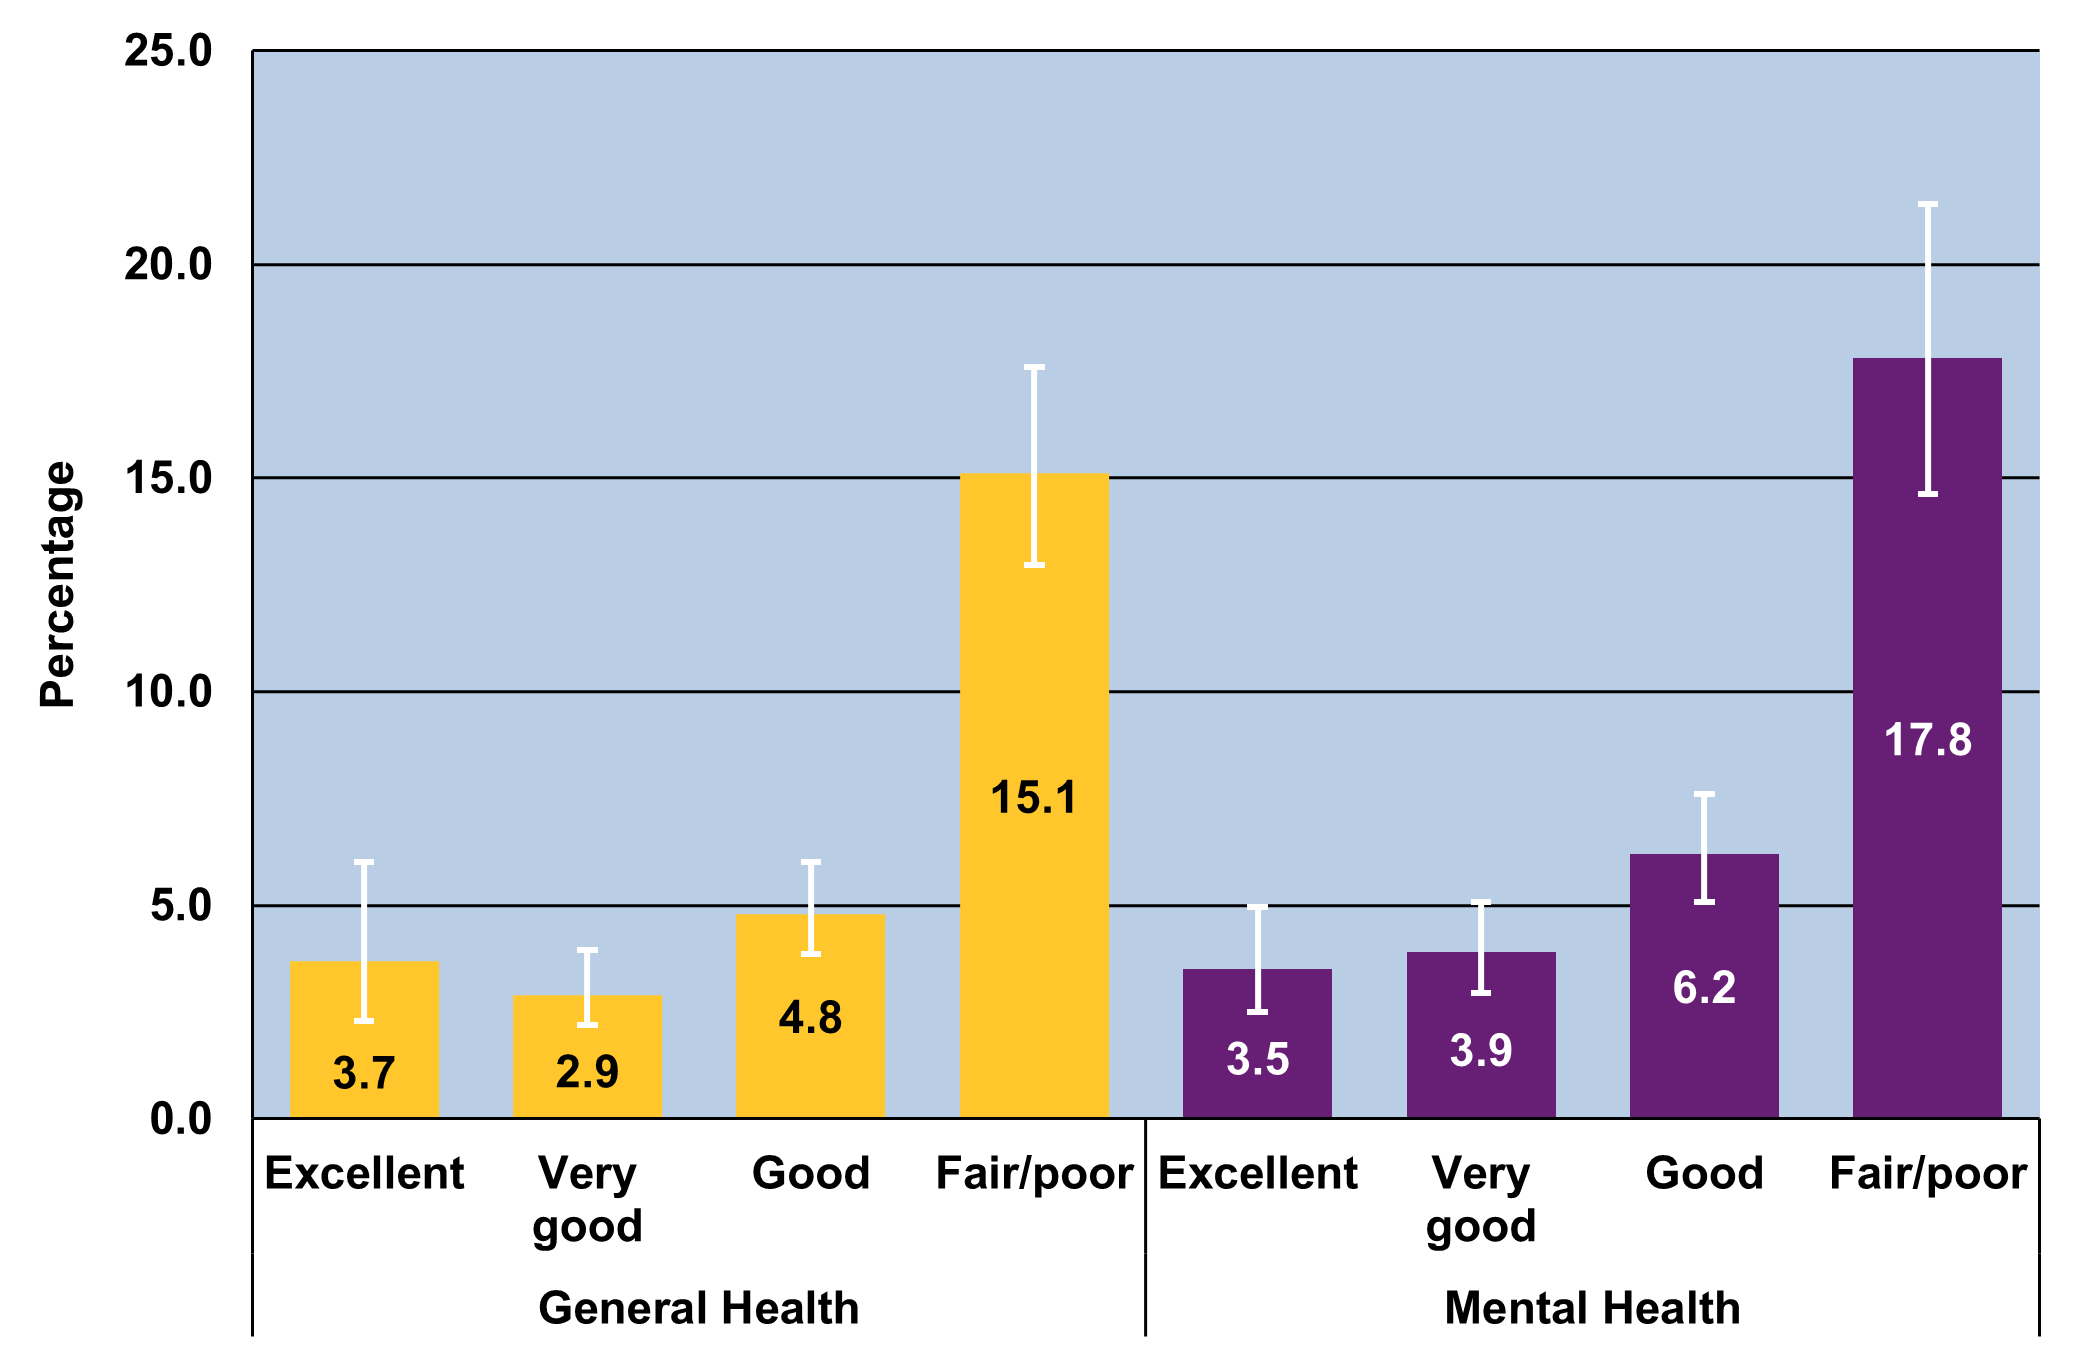
- Those in fair or poor physical health (15.1%) or mental health (17.8%) were more likely than those in excellent physical health (3.7%) or mental health (3.5%) to lack reliable transportation.
- Current smokers (15.5%) and adults with chronic health conditions like stroke (11.3%), asthma (10.2%), and emphysema (12.1%) were more likely than those without any of these conditions (3.0%) to lack reliable transportation.
- The likelihood of lacking reliable transportation increased with an adult's number of health conditions.
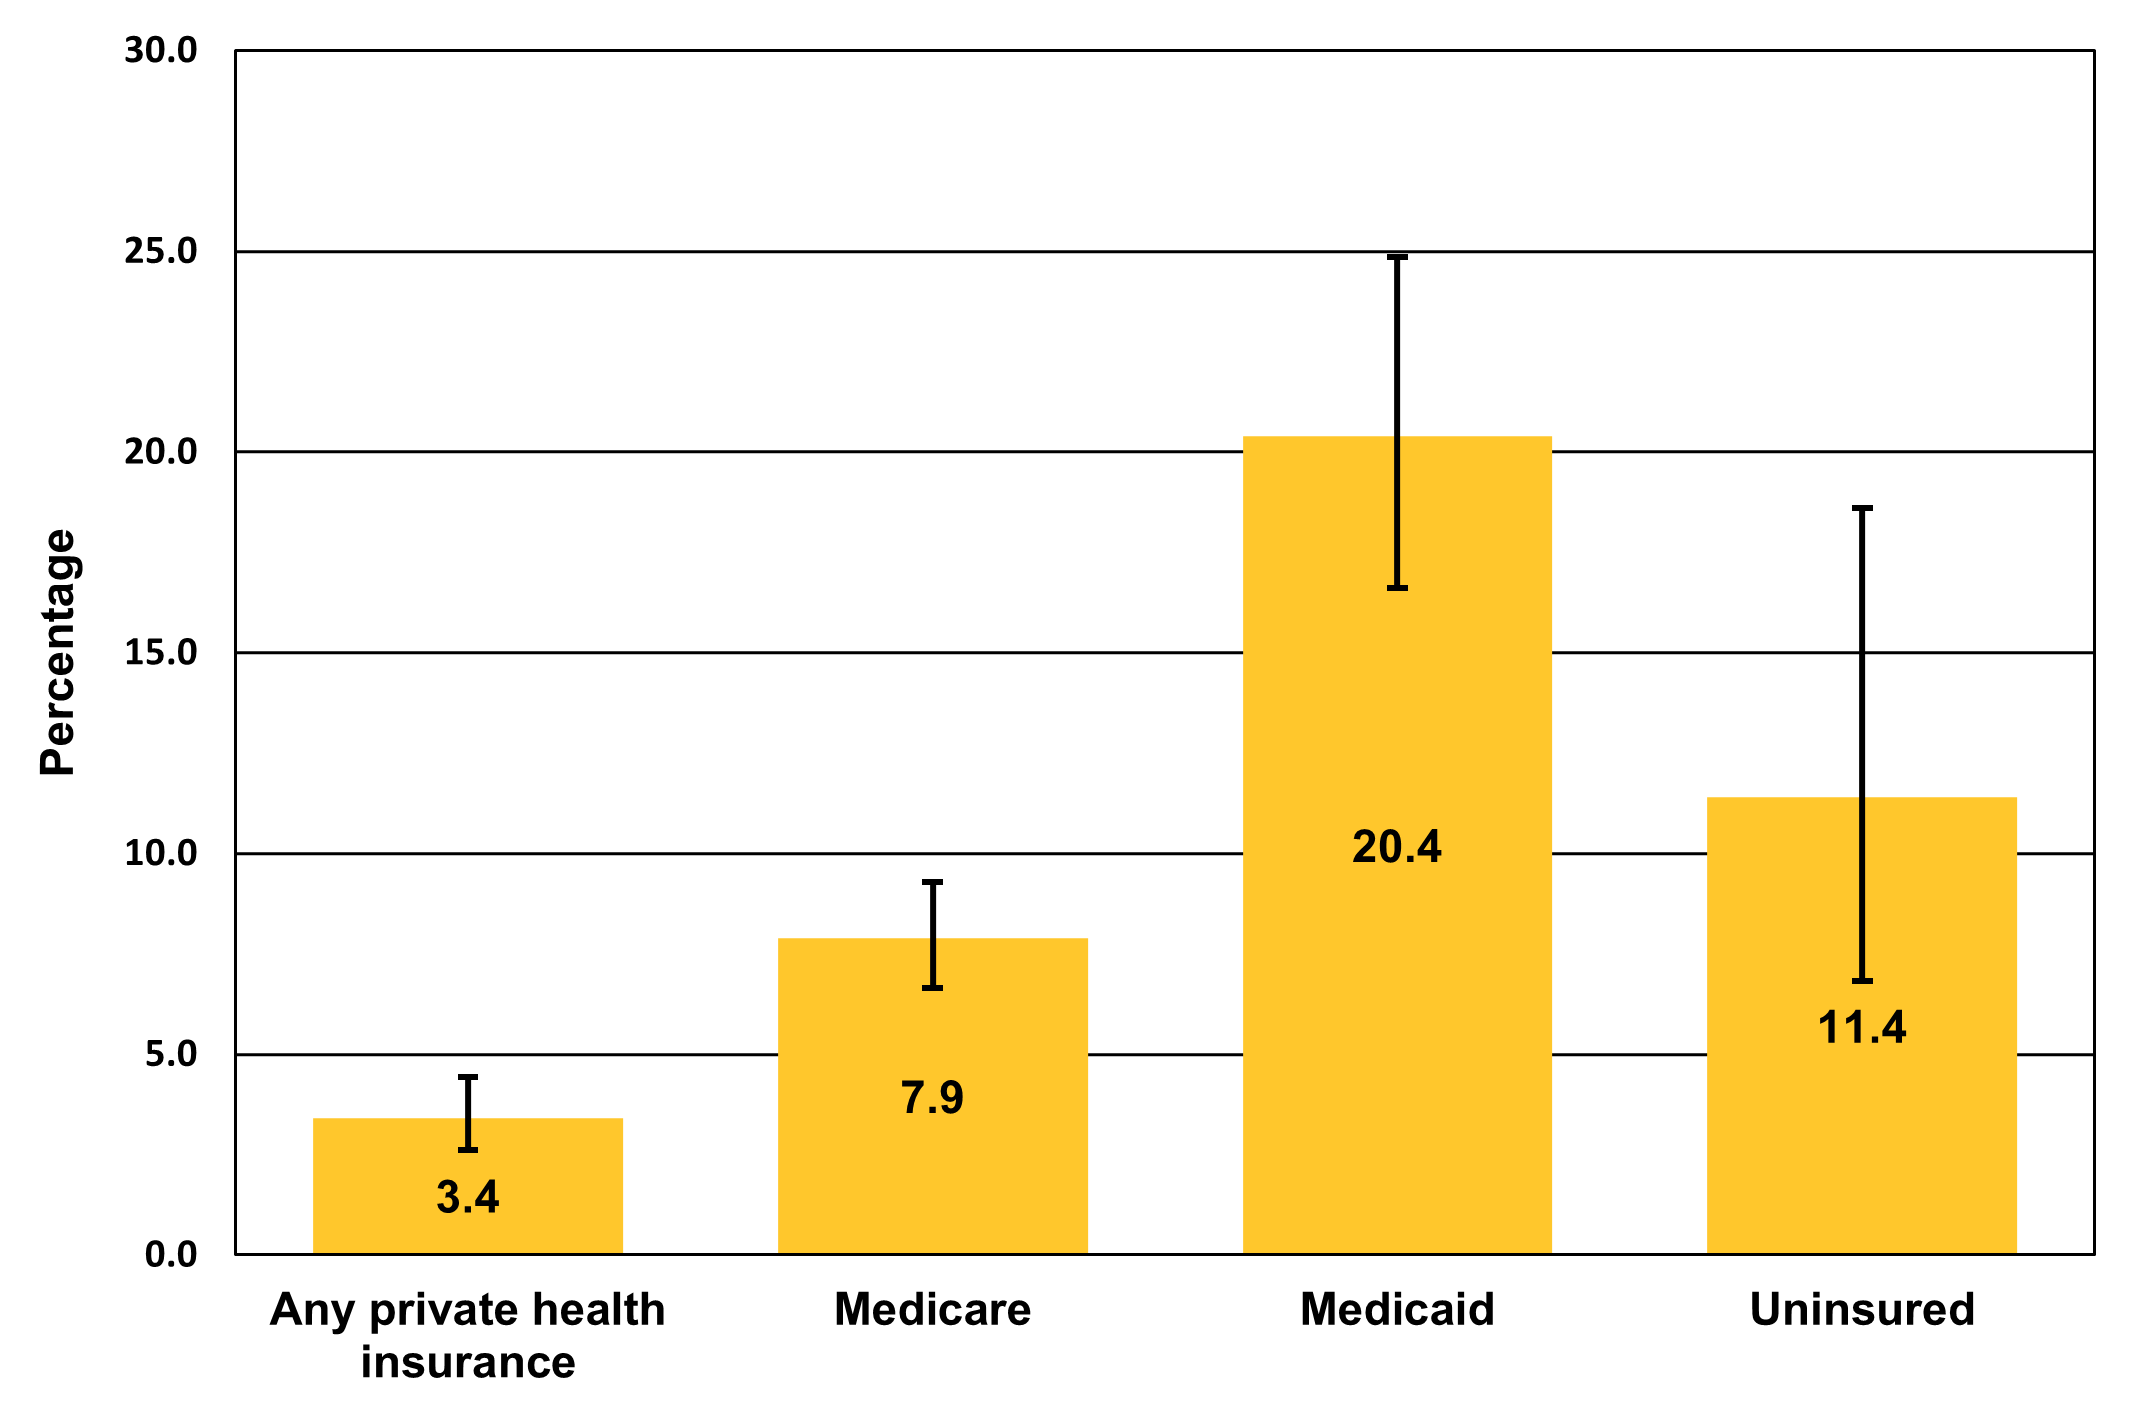
- Adults with public health insurance were more likely than those with private health insurance (3.4%) to lack reliable transportation. The highest percentage of adults lacking reliable transportation was found among adults with Medicaid (20.4%). One-third of adults with Medicaid in fair or poor health lacked reliable transportation.
Introduction
Access to reliable transportation is a critical aspect of daily life that influences access to healthcare services,1 as well as social engagement2 and employment opportunities.3 For this reason, provider groups such as the National Association of Community Health Centers (NACHC) and the Centers for Medicare & Medicaid Services' (CMS) Accountable Health Communities (AHC) have designed provider tools to ask patients about transportation problems in addition to other social determinants of health.4,5
Previous work has documented the fact that adults with less education and lower family incomes are more likely to lack reliable transportation.6 We expanded this analysis to consider the prevalence of lack of reliable transportation by health insurance status and type, general physical and mental health status, and presence and number of chronic conditions. The analyses by health insurance type and by presence and number of chronic conditions may help providers—such as users of the NACHC and CMS AHC tools—look for the kinds of patients for whom lack of reliable transportation may function as a barrier to accessing healthcare.
The data source is the Agency for Healthcare Research and Quality's (AHRQ) 2021 Medical Expenditure Panel Survey Household Component (MEPS-HC). The MEPS-HC question on reliable transportation was developed by NACHC and is used by CMS's AHC.4,5 The analysis sample represents all adults aged 18 and older in the U.S. civilian noninstitutionalized population. All differences mentioned in the text are significant at the p<0.05 level or better.
Findings
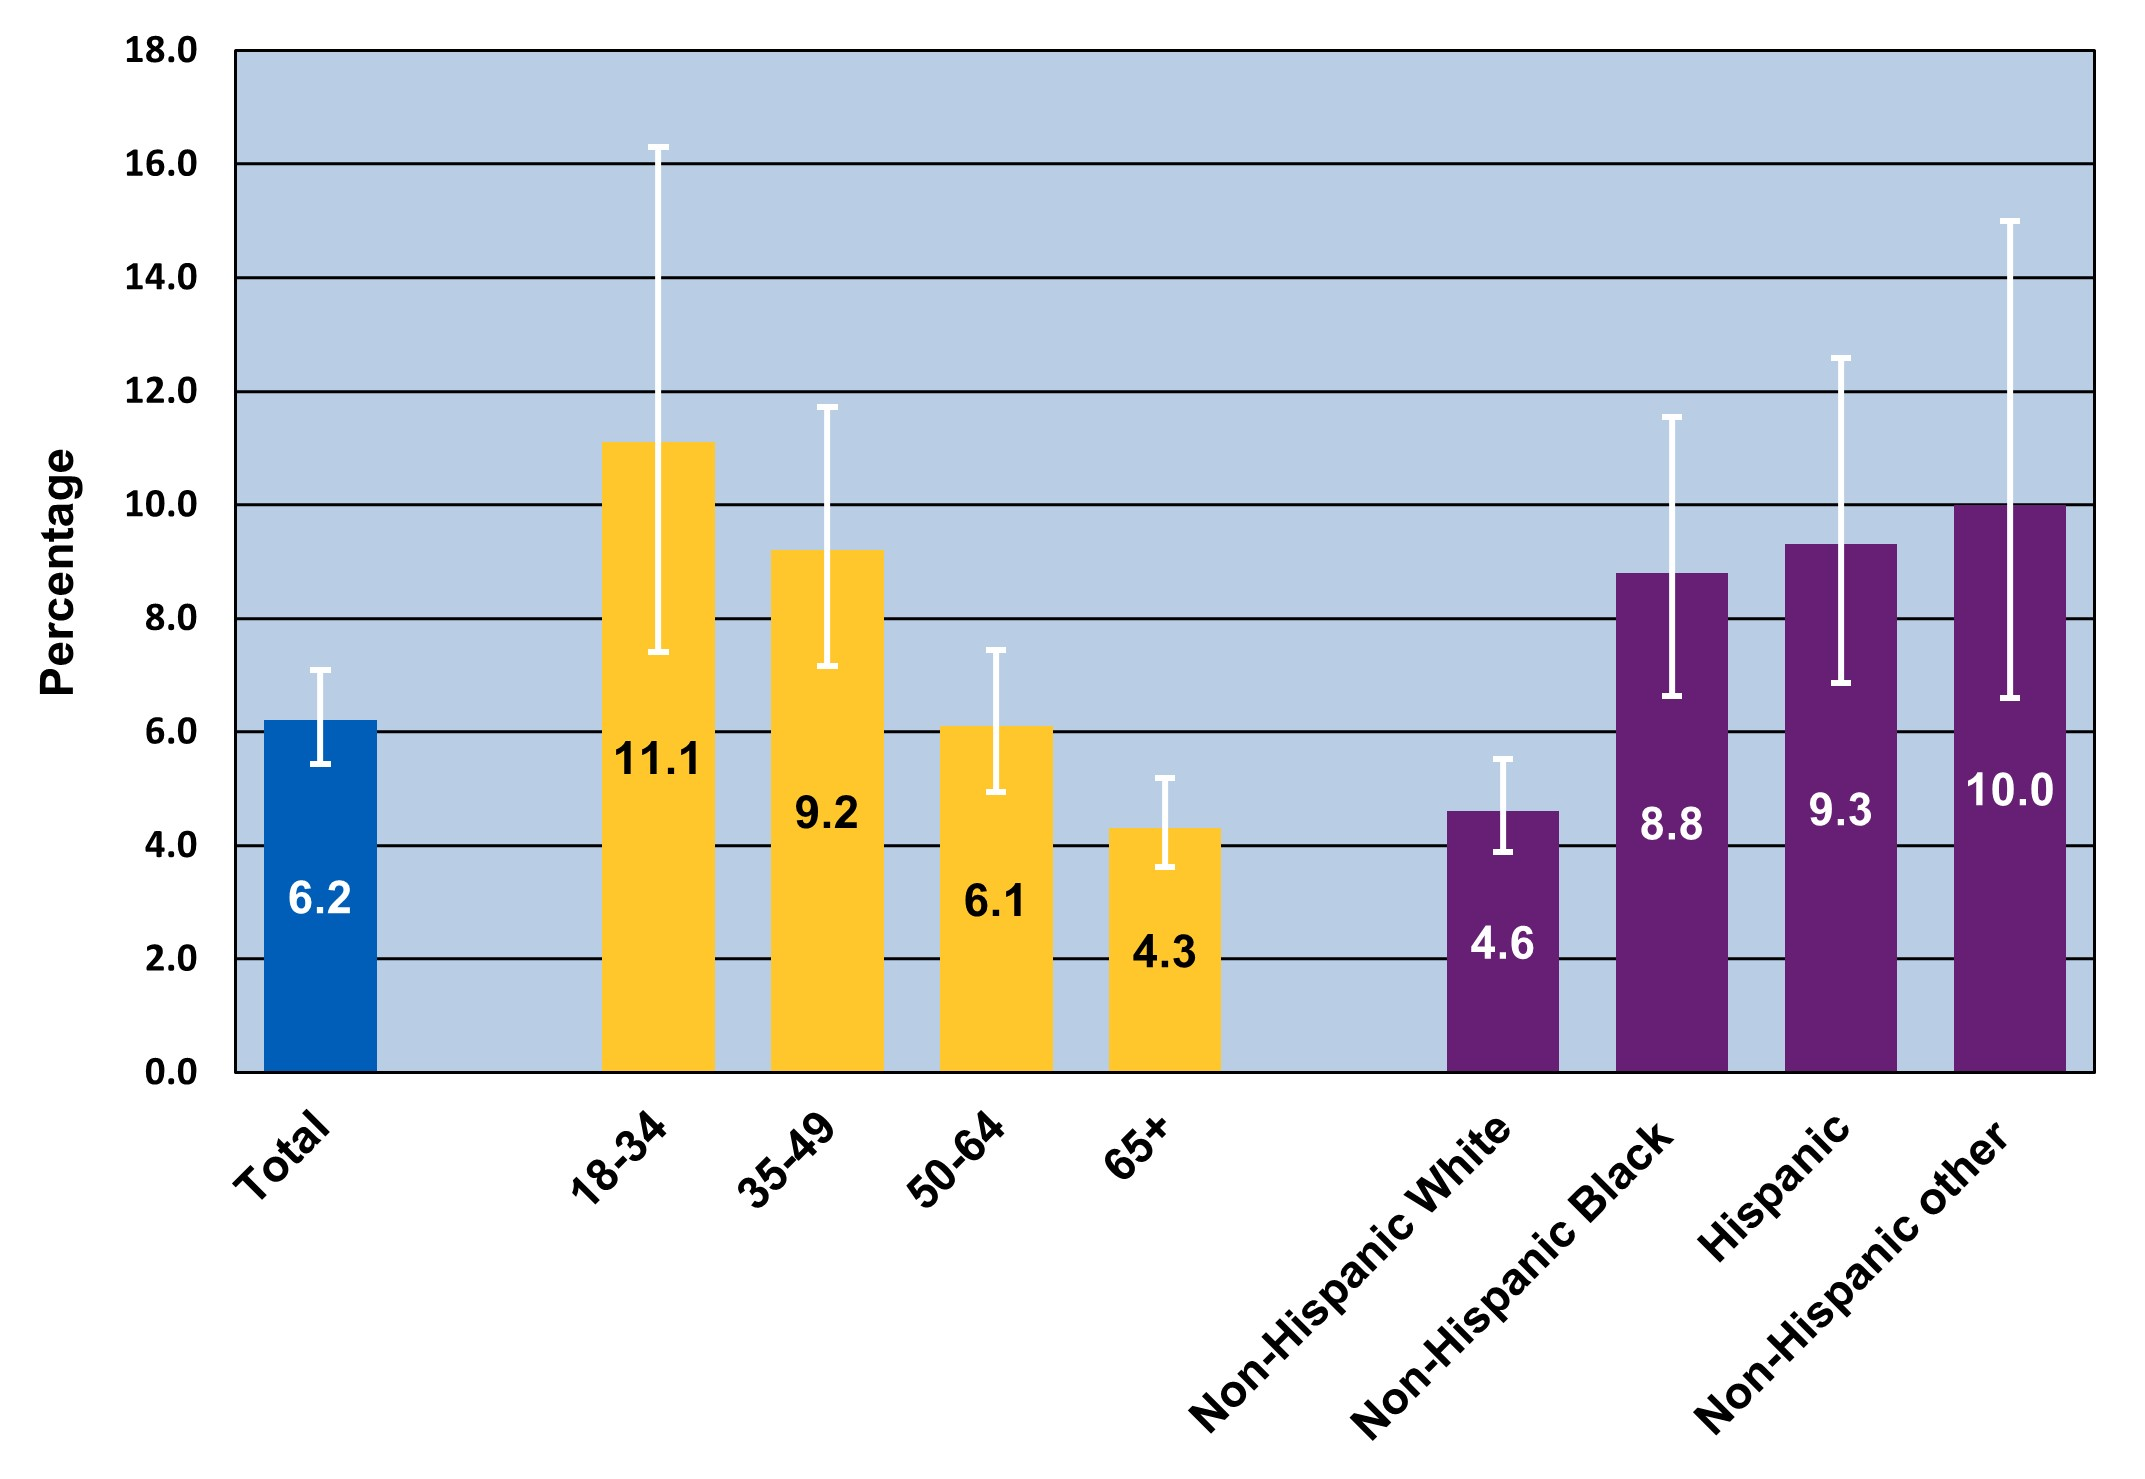
Overall, 6.2 percent of U.S. civilian noninstitutionalized adults reported that lack of reliable transportation had kept them from medical appointments, meetings, or work, or from getting things needed for daily living, in the past 12 months (figure 1).
Age and race/ethnicity (figure 1)
A higher percentage of adults aged 18-34 reported lacking reliable transportation (11.1%), compared with adults aged 50-64 (6.1%) and adults aged 65 years and older (4.3%). Higher percentages of adults lacking reliable transportation were found among non-Hispanic Black adults (8.8%), Hispanic adults (9.3%), and non-Hispanic other adults (10.0%), compared with non-Hispanic White adults (4.6%).
Insurance status and type (figure 2)
The percentage of adults with private health insurance who lacked reliable transportation (3.4%) was lower than the percentage among uninsured adults (11.4%) and adults with public insurance. Adults with Medicare were more likely (7.9%) and those with Medicaid were much more likely (20.4%) to lack reliable transportation than adults with private health insurance.
General health and mental health status (figure 3)
Adults in fair or poor health were much more likely (15.1%) to lack reliable transportation than adults in excellent health (3.7%). Adults with fair or poor mental health were much more likely (17.8%) and those with good mental health were more likely (6.2%) than those with excellent mental health (3.5%) to lack reliable transportation.
General health status and insurance type (figure 4)
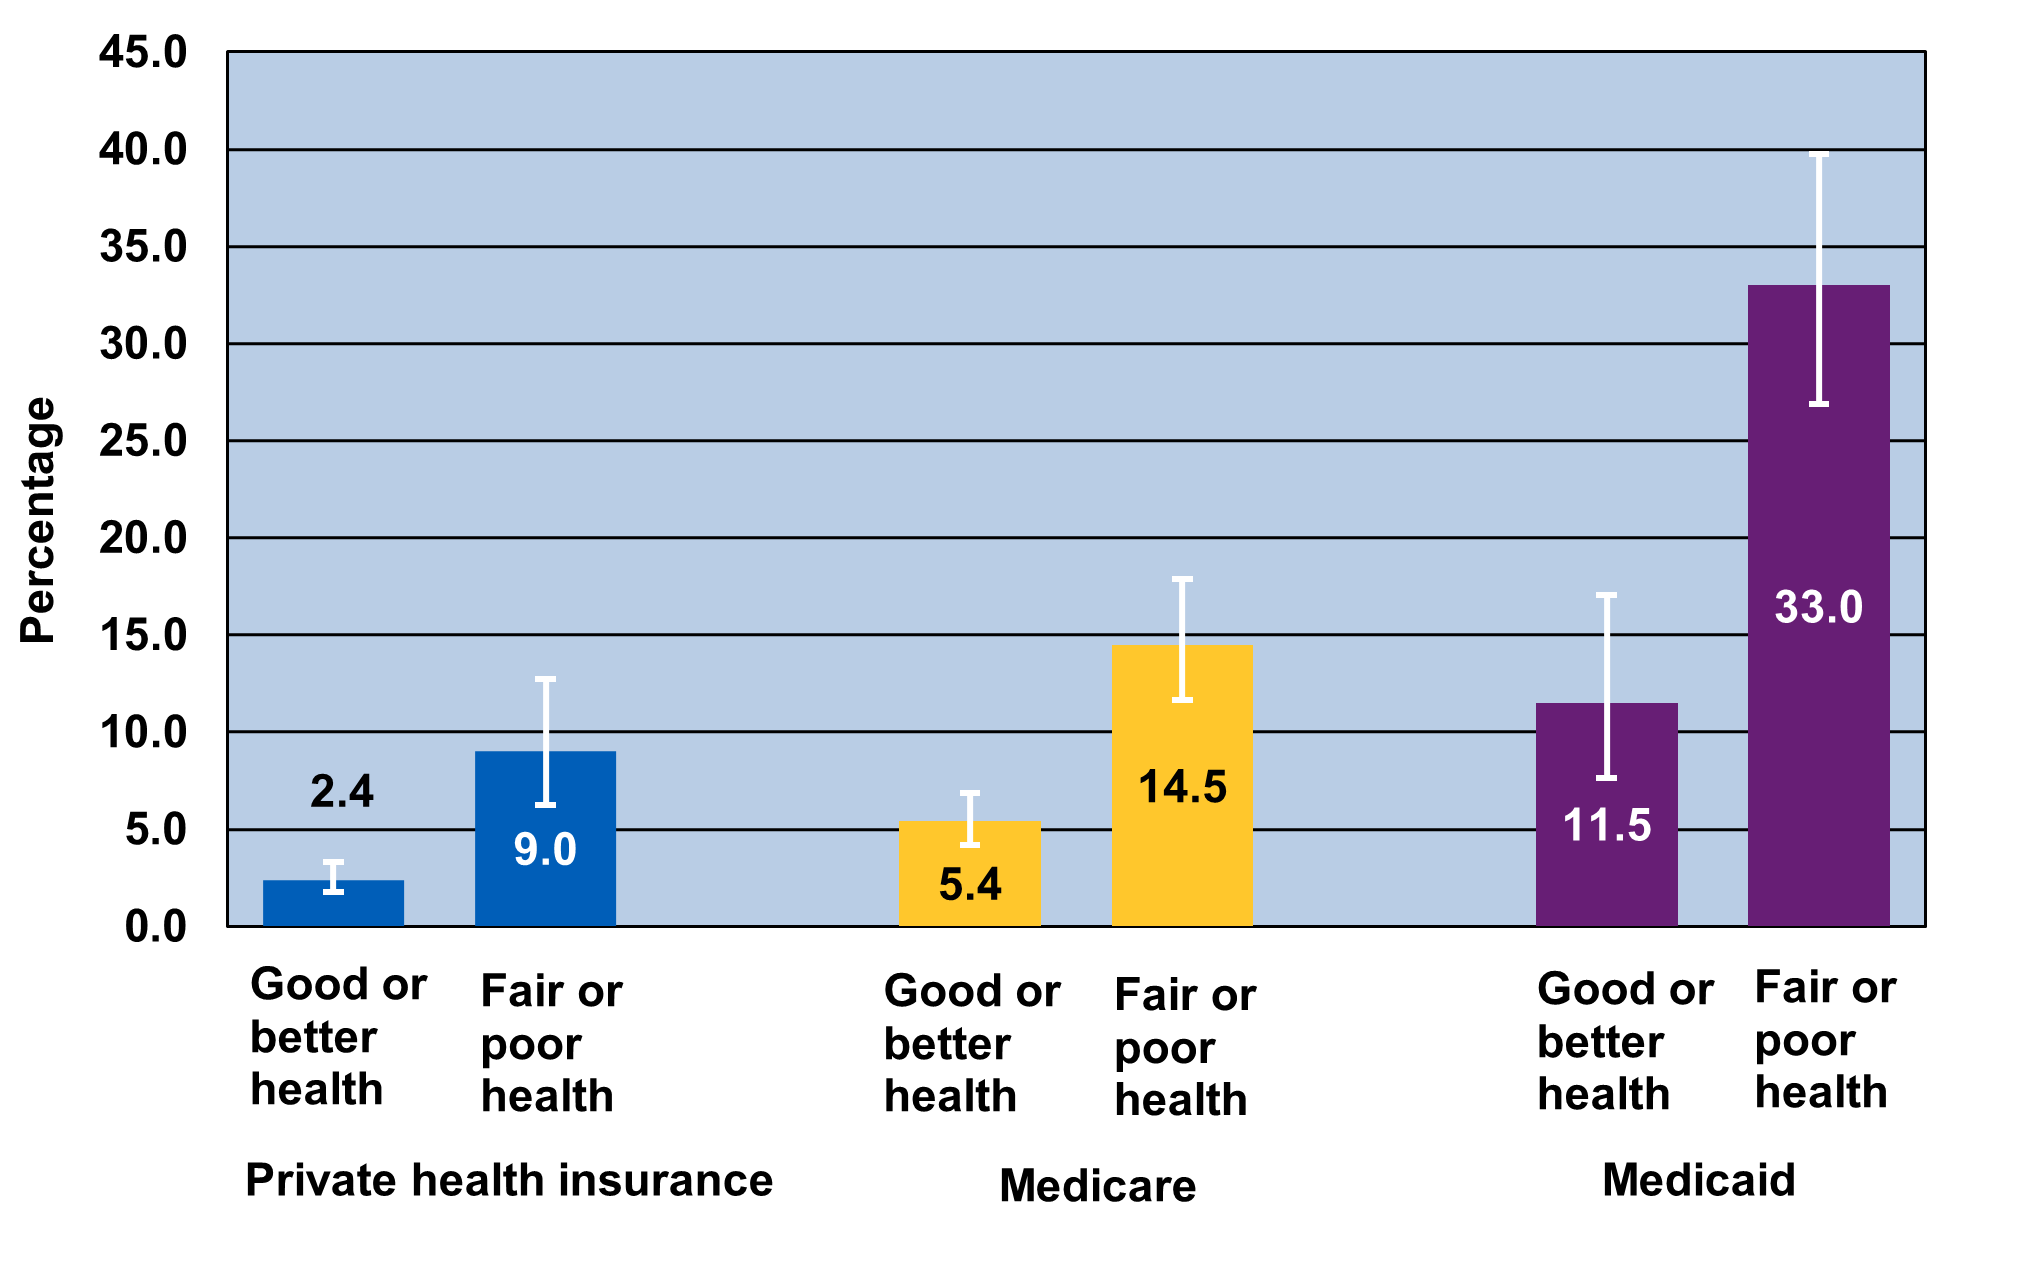
Adults in fair or poor health were more likely than those in good or better health to lack reliable transportation. This was true for adults with all types of insurance. The difference was largest for adults with Medicaid. One-third (33%) of adults with Medicaid in fair or poor health lacked reliable transportation in the last 12 months.
Health conditions (figure 5)
A higher percentage of adults who smoked (15.5%) lacked reliable transportation compared with adults without any of the health conditions listed in figure 5 (3.0%). With the exception of adults with cancer, higher percentages of adults lacking reliable transportation were found among adults with each of the listed health conditions, compared with adults with none of these health conditions. For example, 12.1 percent of adults with emphysema lacked reliable transportation compared with 3.0 percent of adults with none of the listed health conditions.
Number of health conditions (figure 6)
Adults with more health conditions were more likely to lack reliable transportation. Specifically, 6.6 percent of adults with at least one of the health conditions listed in figure 5, 7.7 percent of adults with at least two of the listed health conditions, and 9.1 percent of adults with at least three of the listed health conditions lacked reliable transportation compared with 3.0 percent of adults with no health conditions.
Data Source
This Statistical Brief uses data from the 2021 Medical Expenditure Panel Survey (MEPS) Full-Year Consolidated Data File (HC-233). The question about lack of reliable transportation came from the 2021 MEPS Social and Health Experiences Self-Administered Questionnaire (https://meps.ahrq.gov/survey_comp/survey.jsp), a multimode supplement fielded in spring 2021, with followup for nonresponse conducted in fall 2021.7
Definitions
Lack of reliable transportation
The supplement asked adults, "In the past 12 months, has lack of reliable transportation kept you from medical appointments, meetings, work, or from getting things needed for daily living?"
Age
Age was categorized based on the age of the respondent around the time the supplement was initiated. (AGE31X)
Race/ethnicity
Classification by race/ethnicity was based on information reported for each family member. First, respondents were asked if the person's main national origin or ancestry was Puerto Rican; Cuban; Mexican, Mexican American, or Chicano; other Latin American; or other Spanish. People whose main national origin or ancestry was reported in one of these Hispanic groups were classified as Hispanic, regardless of racial background. All other people were classified according to their reported race. For this analysis, the following classification by race and ethnicity was used: Hispanic, non-Hispanic Black, non-Hispanic White, non-Hispanic Asian, and non-Hispanic other. The "other" category included American Indian, Alaska Native, other race, and multiple races. (RACEV1X, HISPANX)
Insurance coverage
- Any private insurance: A person had any private insurance coverage, including TRICARE/CHAMPVA, at any time during 2021. If a person had both public and private insurance, this person was classified as having private insurance coverage. (INSCOV21)
- Medicaid: A person had insurance coverage through Medicaid or the Children's Health Insurance Program (CHIP) at any time during 2021. (MCDEV21)
- Medicare: A person had insurance coverage through Medicare at any time during 2021. If a person had coverage through Medicaid (or CHIP) and Medicare, this person was classified as having Medicare coverage. (MCREV21)
- Uninsured: A person was uninsured for the duration of 2021. (INSCOV21)
Perceived health status
The MEPS respondent was asked to rate the health of each person in the family around the time the supplement was initiated using the following categories: excellent, very good, good, fair, and poor. (RTHLTH31)
Perceived mental health status
The MEPS respondent was asked to rate the mental health of each person around the time the supplement was initiated using the following categories: excellent, very good, good, fair, and poor. (MNHLTH31)
Conditions
The MEPS respondent was asked whether each adult member of the family had ever been diagnosed with any of the following conditions:
- Diabetes: Whether the person had ever been diagnosed with diabetes (excluding gestational diabetes) (DIABDX_M18)
- Emphysema: Whether the person had ever been diagnosed with emphysema (EMPHDX)
- Cancer: Whether the person had ever been diagnosed as having cancer or a malignancy of any kind (CANCERDX)
- Heart disease: Whether the person had ever been diagnosed as having coronary heart disease (CHDDX), angina or angina pectoris (ANGIDX), a heart attack or a myocardial infarction (MIDX), or any other kind of heart disease or condition (OHRTDX)
- Current smoker: Whether the person currently smoked every day, some days, or not at all (OFTSMK53)
- Asthma: Whether the person had ever been diagnosed with asthma (ASTHDX)
- Hypertension: Whether the person had been told on two or more different visits that they had high blood pressure (BPMLDX)
- Stroke: Whether the person had ever been diagnosed as having had a stroke or transient ischemic attack (or ministroke) (STRKDX)
- High cholesterol: Whether the person had ever been diagnosed as having high cholesterol (CHOLDX)
Number of health conditions
The categories "at least two conditions," "at least three conditions," and "at least four conditions" are based on the conditions listed above.
About MEPS-HC
The MEPS-HC collects nationally representative data on healthcare use, expenditures, sources of payment, and insurance coverage for the U.S. civilian noninstitutionalized population. The MEPS-HC is cosponsored by the Agency for Healthcare Research and Quality (AHRQ) and the National Center for Health Statistics (NCHS). More information about the MEPS-HC can be found at https://meps.ahrq.gov/.
For a detailed description of the MEPS-HC survey design, sample design, and methods used to minimize sources of nonsampling error, see the following publications:
Cohen, J. Design and Methods of the Medical Expenditure Panel Survey Household Component. MEPS Methodology Report No. 1. AHCPR Pub. No. 97-0026. 1997. Agency for Health Care Policy and Research (AHCPR), Rockville, MD. https://meps.ahrq.gov/data_files/publications/mr1/mr1.pdf
Cohen S. Sample Design of the 1996 Medical Expenditure Panel Survey Household Component. MEPS Methodology Report No. 2. AHCPR Pub. No. 97-0027. 1997. Agency for Health Care Policy and Research, Rockville, MD. https://meps.ahrq.gov/data_files/publications/mr2/mr2.pdf
References
1 Syed ST, Gerber BS, Sharp LK. Traveling towards disease: transportation barriers to health care access. J Community Health. 2013;38(5):976-93.
2 Levasseur M, Généreux M, Bruneau J-F, Vanasse A, Chabot E, Beaulac C, Bédard M-M. Importance of proximity to resources, social support, transportation and neighborhood security for mobility and social participation in older adults: results from a scoping study. BMC Public Health. 2015;15:1-19.
3 Jones MM, Graham JR, Shier ML.. Linking transportation inadequacies to negative employment outcomes. Canadian Review of Social Policy. 2008;60/61:91-108.
4 Centers for Medicare and Medicaid Services. The Accountable Health Communities Health-Related Social Needs Screening Tool. https://www.cms.gov/priorities/innovation/files/worksheets/ahcm-screeningtool.pdf. Accessed November 17, 2024.
5 National Association of Community Health Centers and Partners, National Association of Community Health Centers, Association of Asian Pacific Community Health Organizations, Association OPC, Institute for Alternative Futures. PRAPARE. https://prapare.org/the-prapare-screening-tool/. Accessed November 17, 2024.
6 Ng AE, Adjaye-Gbewonyo D, Dahlhamer J. Lack of reliable transportation for daily living among adults: United States, 2022. NCHS Data Brief, no. 490. Hyattsville, MD: National Center for Health Statistics; 2024. doi: https://dx.doi.org/10.15620/cdc:135611
7 Kistler A, Decker S, Steiger D, Novik J. A multimode strategy to contact participants and collect responses in a supplement to a longitudinal household survey. Survey Methods: Insights from the Field. 2024;2(1). https://surveyinsights.org/?p=18357
Suggested Citation
Wu X, Decker SL. Lack of Reliable Transportation for Daily Living Among Adults: United States, 2021. Statistical Brief #558. AHRQ Publication No. 25-0017-1-EF. Rockville, MD: Agency for Healthcare Research and Quality; November 2024. https://meps.ahrq.gov/data_files/publications/st558/stat558.shtml
AHRQ welcomes questions and comments from readers of this publication who are interested in obtaining more information about access, cost, use, financing, and quality of healthcare in the United States. We also invite you to tell us how you are using this Statistical Brief and other MEPS data and tools and to share suggestions on how MEPS products might be enhanced to further meet your needs. Please email us at MEPSProjectDirector@ahrq.hhs.gov or send a letter to the address below:
Joel W. Cohen, PhD, Director
Center for Financing, Access and Cost Trends
Agency for Healthcare Research and Quality
5600 Fishers Lane, Mailstop 07W41A
Rockville, MD 20857
Figure 1. Percentage of adults (aged 18 and older) who lacked reliable transportation for daily living in the past 12 months, by age and race/ethnicity, 2021
| Group | Percentage of adults (aged 18 and older) who lacked reliable transportation for daily living in the past 12 months |
|---|---|
| Total | 6.2 |
| Age | |
| 18-34 | 11.1 |
| 35-49 | 9.2 |
| 50-64 | 6.1 |
| 65+ | 4.3 |
| Race/ethnicity | |
| Non-Hispanic White | 4.6 |
| Non-Hispanic Black | 8.8 |
| Hispanic | 9.3 |
| Non-Hispanic other | 10.0 |
Note: The vertical lines in the chart indicate the 95% confidence interval for the
estimates.
Source: Agency for Healthcare Research and Quality, Medical Expenditure Panel Survey,
Household Component, 2021.
Figure 2. Percentage of adults (aged 18 and older) who lacked reliable transportation for daily living in the past 12 months, by insurance status and type, 2021
| Insurance type | Percentage of adults (aged 18 and older) who lacked reliable transportation for daily living in the past 12 months |
|---|---|
| Any private health insurance | 3.4 |
| Medicare | 7.9 |
| Medicaid | 20.4 |
| Uninsured | 11.4 |
Note: The vertical lines in the chart indicate the 95% confidence interval for the
estimates.
Source: Agency for Healthcare Research and Quality, Medical Expenditure Panel Survey,
Household Component, 2021.
Figure 3. Percentage of adults (aged 18 and older) who lacked reliable transportation for daily living in the past 12 months, by general health and mental health status, 2021
| Health status | Percentage of adults (aged 18 and older) who lacked reliable transportation for daily living in the past 12 months |
|---|---|
| General Health | |
| Excellent | 3.7 |
| Very good | 2.9 |
| Good | 4.8 |
| Fair/poor | 15.1 |
| Mental health | |
| Excellent | 3.5 |
| Very good | 3.9 |
| Good | 6.2 |
| Fair/poor | 17.8 |
Note: The vertical lines in the chart indicate the 95% confidence interval for the
estimates.
Source: Agency for Healthcare Research and Quality, Medical Expenditure Panel Survey,
Household Component, 2021.
Figure 4. Percentage of adults (aged 18 and older) who lacked reliable transportation for daily living in the past 12 months, by insurance and health status, 2021
| Group | Percentage of adults (aged 18 and older) who lacked reliable transportation for daily living in the past 12 months |
|---|---|
| Private health insurance and general health status | |
| Any private health insurance and good or better health | 2.4 |
| Any private health insurance and fair or poor health | 9.0 |
| Medicare and general health status | |
| Medicare and good or better health | 5.4 |
| Medicare and fair or poor health | 14.5 |
| Medicaid and general health status | |
| Medicaid and good or better health | 11.5 |
| Medicaid and fair or poor health | 33.0 |
| Uninsured and general health status | |
| Uninsured and good or better health | - |
| Uninsured and fair or poor health | - |
Note: The vertical lines in the chart indicate the 95% confidence interval for the
estimates.
Source: Agency for Healthcare Research and Quality, Medical Expenditure Panel Survey,
Household Component, 2021.
Figure 5. Percentage of adults (aged 18 and older) who lacked reliable transportation for daily living in the past 12 months, by health condition, 2021
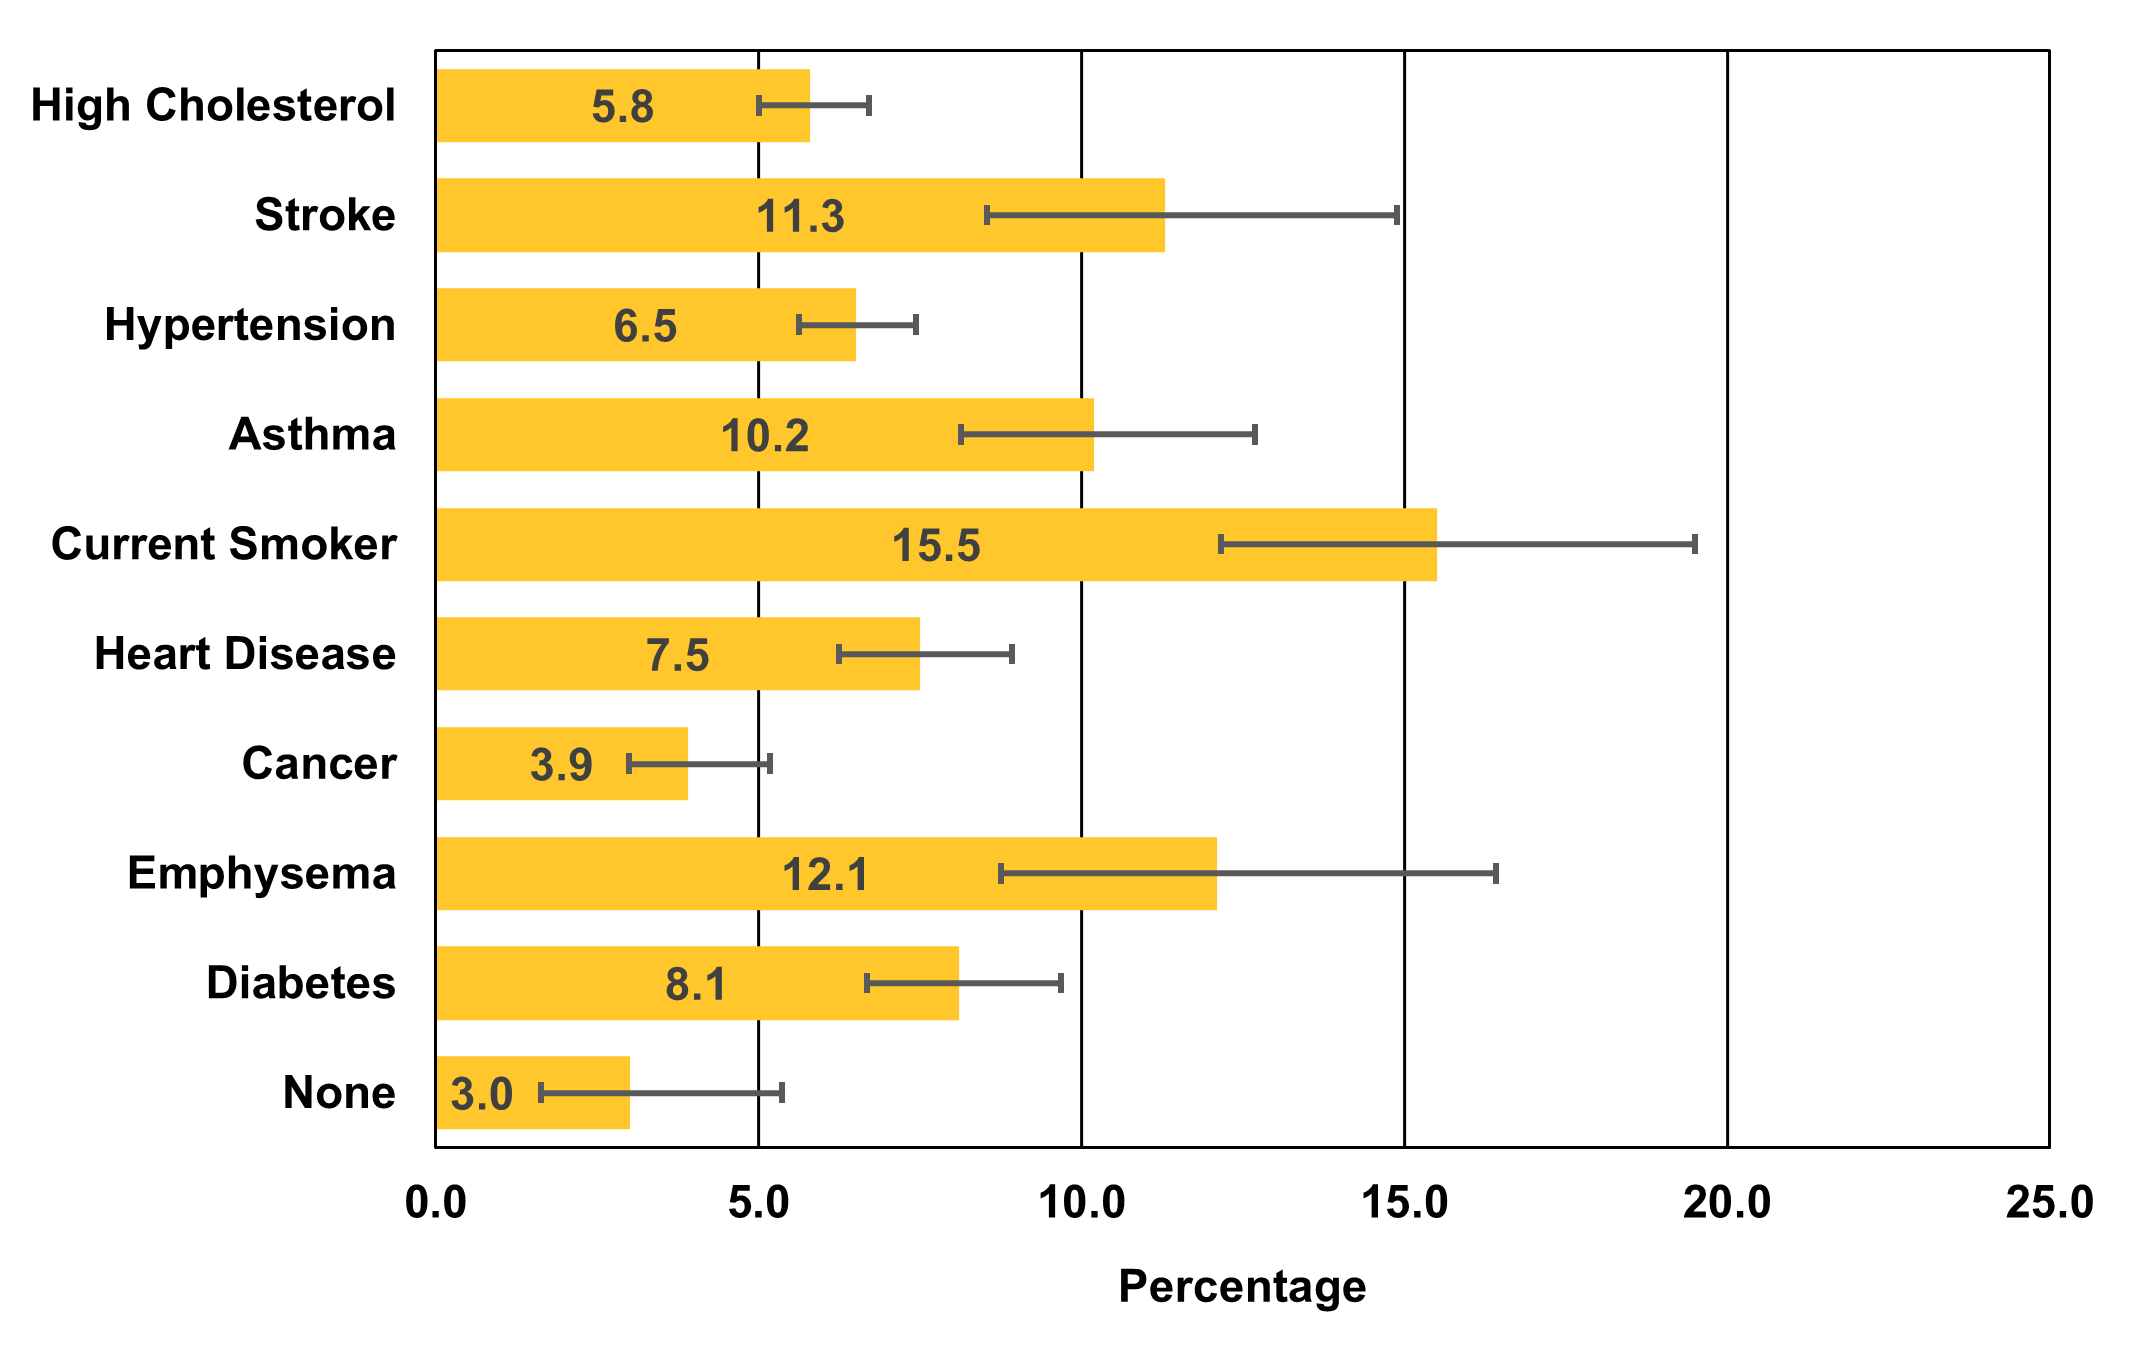
| Group | Percentage of adults (aged 18 and older) who lacked reliable transportation for daily living in the past 12 months, by health condition, 2021 |
|---|---|
| None | 3.0 |
| Diabetes | 8.1 |
| Emphysema | 12.1 |
| Cancer | 3.9 |
| Heart Disease | 7.5 |
| Current Smoker | 15.5 |
| Asthma | 10.2 |
| Hypertension | 6.5 |
| Stroke | 11.3 |
| High Cholesterol | 5.8 |
Note: The vertical lines in the chart indicate the 95% confidence interval for the
estimates.
Source: Agency for Healthcare Research and Quality, Medical Expenditure Panel Survey,
Household Component, 2021.
Figure 6. Percentage of adults (aged 18 and older) who lacked reliable transportation for daily living in the past 12 months, by number of health conditions, 2021
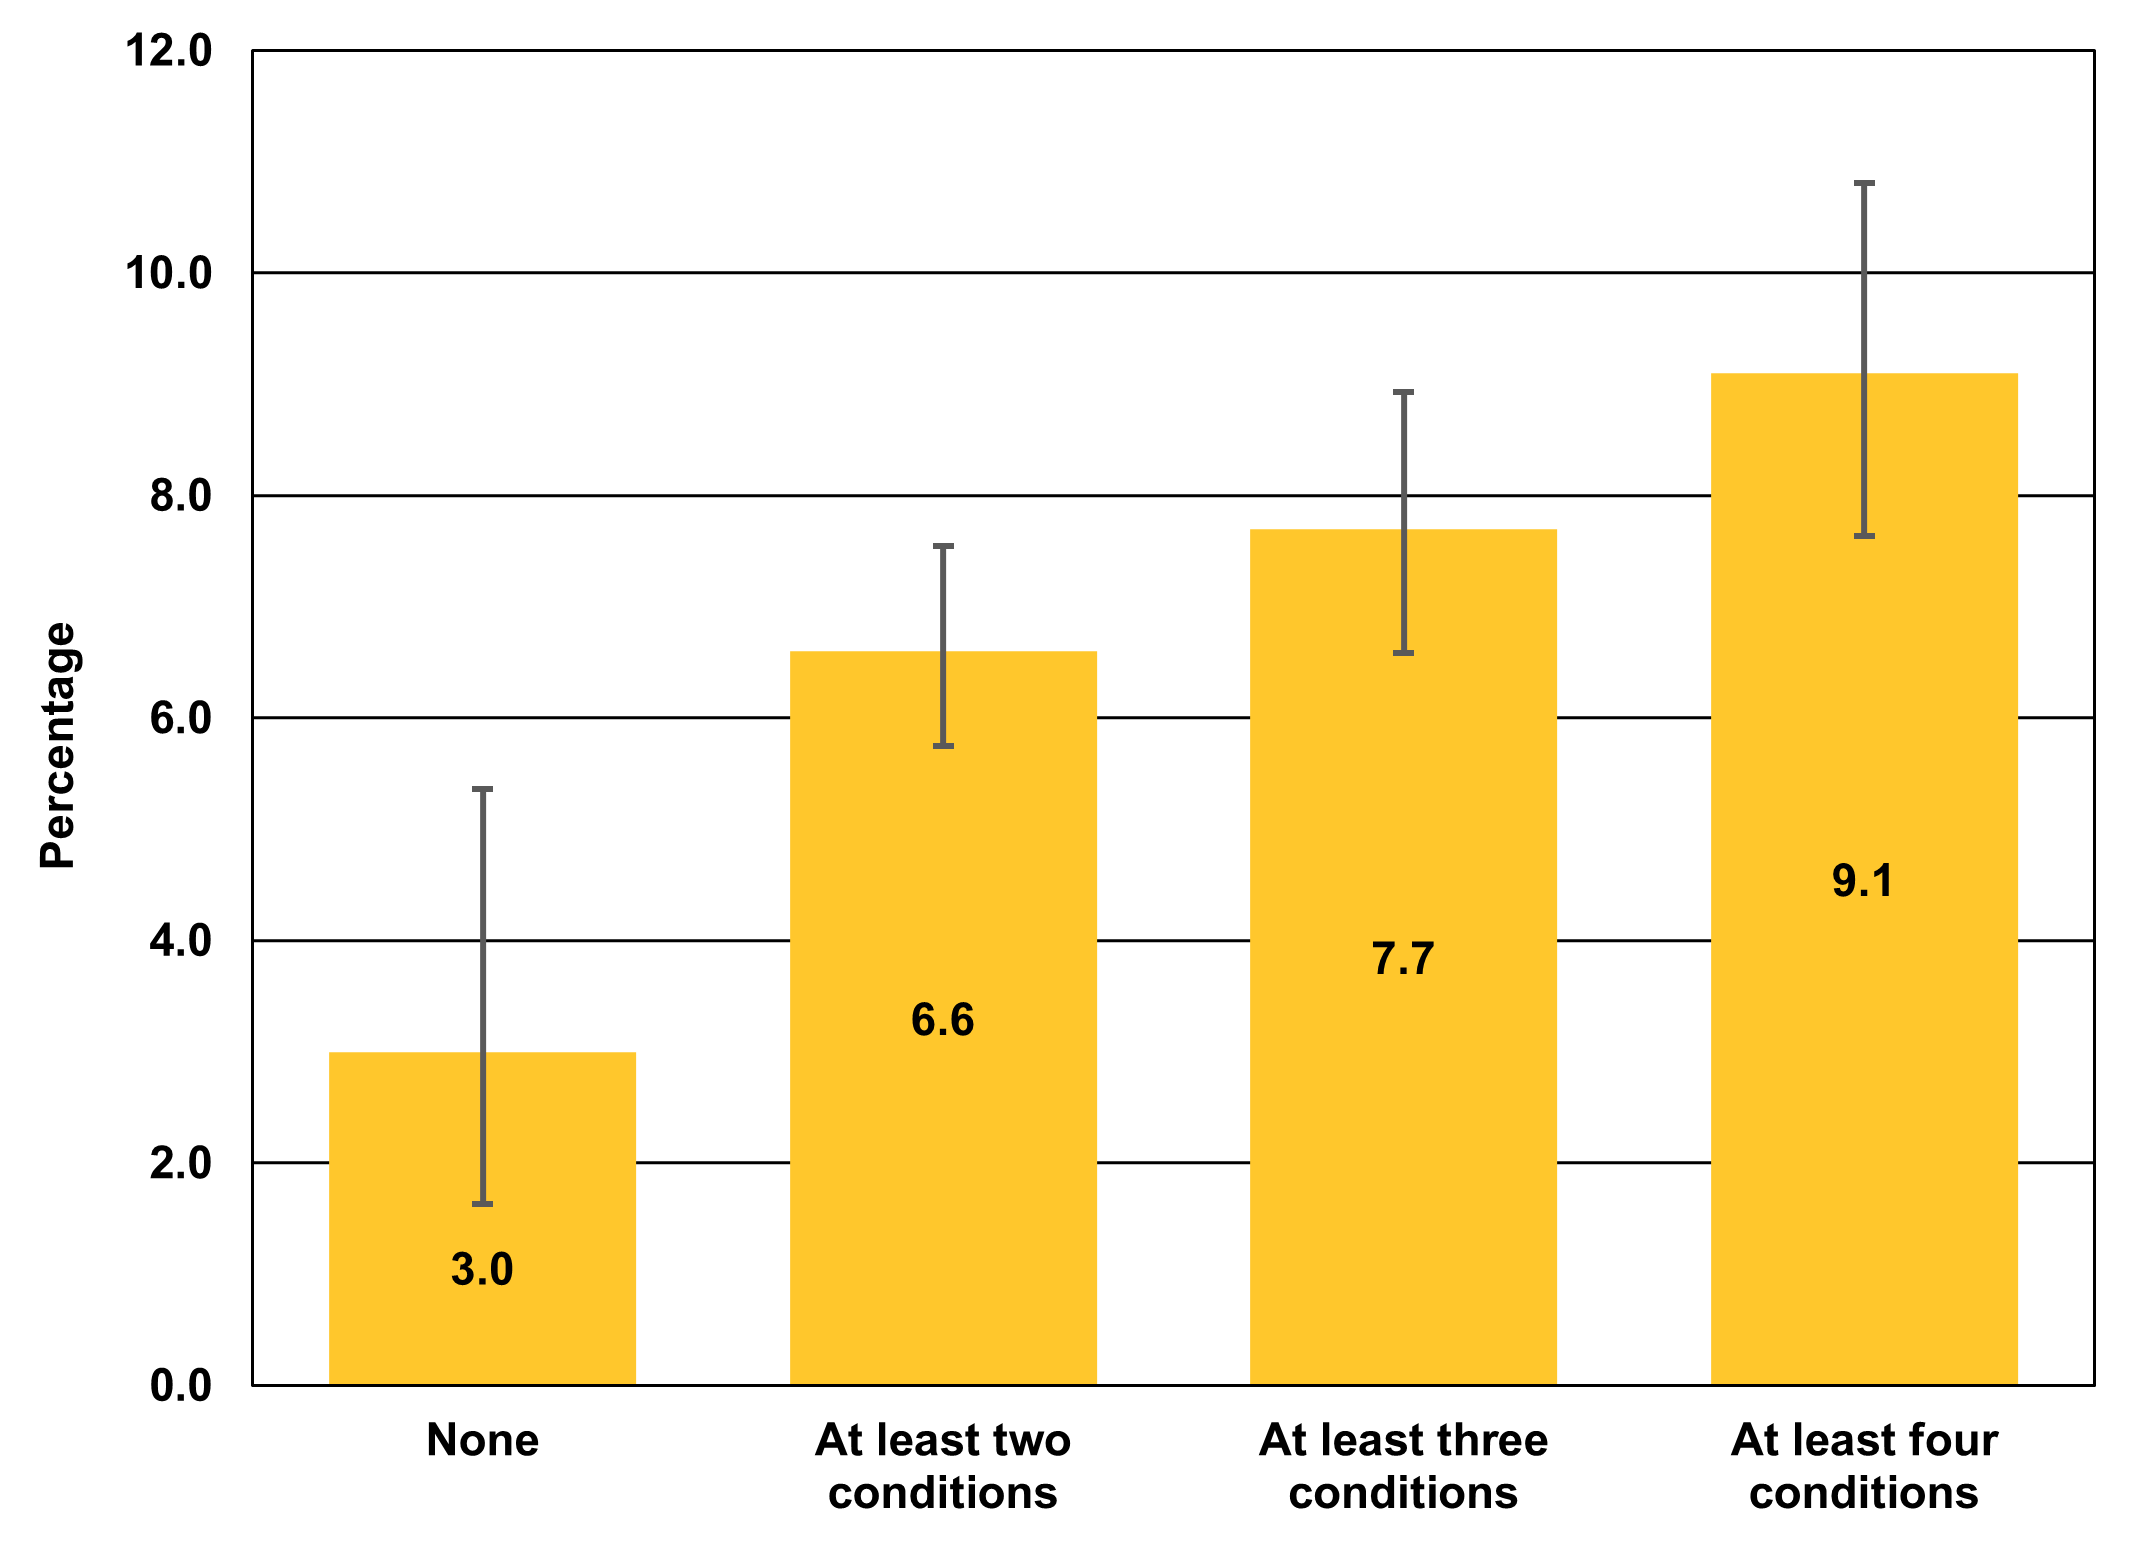
| Group | Percentage of adults (aged 18 and older) who lacked reliable transportation for daily living in the past 12 months |
|---|---|
| None | 3.0 |
| At least two conditions | 6.6 |
| At least three conditions | 7.7 |
| At least four conditions | 9.1 |
Note: The vertical lines in the chart indicate the 95% confidence interval for the
estimates.
Source: Agency for Healthcare Research and Quality, Medical Expenditure Panel Survey,
Household Component, 2021.
AHRQ Pub. No. 25-0017-1-EF
November 2024


