
|
|
|
Font Size:
|
||||
|
|
|
|
||||
Healthcare Expenditures for Heart Disease among Adults Aged 18 and Older in the U.S. Civilian Noninstitutionalized Population, 2022
Statistical Brief #562 | July 2025 | Asako S. Moriya, PhD & Terceira Berdahl, PhD
Highlights
- In 2022, 7.8 percent of adults aged 18 and older were treated for heart disease, and men were more likely than women to have treated heart disease (8.4 % vs. 7.2%).
- Among age groups, the treated prevalence of heart disease was highest for those aged 65 and older (22.8%) compared to only 6.0 percent for adults aged 45-64, and 1.4 percent for adults ages 18-44.
- In 2022, healthcare expenditures to treat heart disease for adults in the US totaled $100.0 billion (with an average cost of $4,900 per adult with diagnosed and treated heart disease).
- The largest portion of heart disease expenditures were incurred through hospital inpatient stays (46.1%) and prescribed medications (20.5%).
- The majority of heart disease treatment costs were paid by Medicare (57.6%) and private insurance (24.2%).
Introduction
Heart disease continues to be the leading cause of death for the United States population in 2022 (Kochanek et al. 2022). This Statistical Brief provides estimates of health service utilization to treat heart disease for adults in the U.S. civilian noninstitutionalized population based on the 2022 Medical Expenditure Panel Survey-Household Component (MEPS-HC). First, service utilization rates for any type of treatment for heart disease by demographic characteristics are presented. Then, this Brief provides estimates of healthcare expenditures for heart disease by type of service and source of payment among adults. All estimates are weighted to account for nonresponse and the MEPS-HC complex survey design. Only differences between statistically significant estimates at the .05 level are discussed in the text.
Findings
Adults who received any heart disease treatment by demographic and socioeconomic characteristics and region (Figures 1 and 2)
In 2022, an estimated 7.8 percent of adults aged 18 years and older in the U.S. civilian noninstitutionalized population (about 20.4 million adults) received any heart disease treatment (Figure 1). This percentage was highest for those aged 65 and older (22.8%), followed by adults aged 45-64 (6.0%) and those aged 18-44 (1.4%). About one out of every ten non-Hispanic white adults (9.7%) received any heart disease treatment. This percentage was lower for non-Hispanic black adults (6.3%), followed by non-Hispanic Asian (3.9%) and Hispanic (3.9%) adults. Men were more likely than women to receive any heart disease treatment (8.4% vs. 7.2%).
A higher percentage of adults in poor- and low-income families had any heart disease treatment (9.5% and 11.0%, respectively) compared with those in families with middle or high incomes (7.5% and 6.6%, respectively). About 8-9 percent of adults received any heart disease treatment in each geographic region, except the West, where only 6.3 percent received medical care for this condition.
Type of medical service for heart disease treatment (Figure 3)
Among adults treated for heart disease in 2022, 68.8 percent had prescribed drug expenses, and 58.3 percent had one or more visits to an office-based medical provider. Relatively, smaller proportions had one or more hospital outpatient visits (20.2%), emergency room visits (13.1%), inpatient hospital stays (10.5%), and home health services (5.1%).
Heart disease treatment expenditures overall and by type of medical service (Figure 4)
In 2022, an estimated $100.0 billion was spent on treatment related to heart disease among adults in the U.S. civilian noninstitutionalized population. At the person level, annual expenditures1 on heart disease treatment, among those with any treatment, were a median of $660 and a mean of $4,900 per individual. Adults with heart disease health conditions sought and paid for various types of medical services in 2022. Hospital inpatient stays were the most expensive type of service utilization, with an average cost of $21,560 and a median cost of $13,370 per patient among adults who were hospitalized for heart disease in 2022. Home health services were the second most expensive, with an average cost of $8,740 and a median cost of $3,850 per patient among those who had home health services for heart disease in 2022. Office-based visits for heart disease were the lowest cost service, with an average of $830 and a median of $350 per patient among adults who had office-based heart disease visits in 2022. For all types of heart disease services, average costs were much higher than median costs because a relatively small proportion of adults had very high expenses.
Percent distribution of heart disease treatment expenses by type of medical service (Figure 5)
The largest portion (46.1%) of annual expenses on heart disease treatment was for hospital inpatient care. Among all other expenditures, 20.5 percent were for prescription medications followed by 11.3 percent for hospital outpatient visits, 9.9 percent for office-based visits, 9.1 percent for home health services, and 3.1 percent for emergency department visits.
Percent distribution of heart disease treatment expenses by source of payment (Figure 6)
Medicare paid the highest share of expenditures for heart disease in 2022 (57.6%), followed by private health insurance (24.2%). Among the remaining sources of payment, Medicaid paid 8.0 percent, followed by out-of-pocket payments (5.6%) and payments by other sources (4.5%).
Data Source
This Statistical Brief uses the following 2022 MEPS public use files: (a) Medical Conditions File (H241), (b) Condition-Event Link File (H239IF1), (c) Office-Based Medical Provider Visits File (H239G), (d) Outpatient Visits File (H239F), (e) Emergency Room Visits File (H239E), (f) Prescribed Medicines File (H239A), (g) Hospital Inpatient Stays File (H239D), (h) Home Health File (H239H), and (i) Full-Year Consolidated Data File (H243). These data files are publicly available at: https://meps.ahrq.gov/data_stats/download_data_files.jsp.
Definitions
Heart disease
MEPS-HC conditions reported by households were coded into International Classification of Diseases, 10th Revision, Clinical Modification (ICD-10-CM) codes, which were then collapsed into Clinical Classifications Software Refined (CCSR) categories. The following specific CCSR categories were combined to create the broader condition category of heart disease.
| CCSR Category | Description |
|---|---|
| CIR001 | Chronic rheumatic heart disease |
| CIR002 | Acute rheumatic heart disease |
| CIR003 | Nonrheumatic and unspecified valve disorders |
| CIR004 | Endocarditis and endocardial disease |
| CIR005 | Myocarditis and cardiomyopathy |
| CIR006 | Pericarditis and pericardial disease |
| CIR009 | Acute myocardial infarction |
| CIR010 | Complications of acute myocardial infarction |
| CIR011 | Coronary atherosclerosis and other heart diseases |
| CIR012 | Nonspecific chest pain |
| CIR013 | Acute pulmonary embolism |
| CIR014 | Pulmonary heart disease |
| CIR015 | Other and ill-defined heart disease |
| CIR016 | Conduction disorders |
| CIR017 | Cardiac dysrhythmias |
| CIR018 | Cardiac arrest and ventricular fibrillation |
| CIR019 | Heart failure |
Individuals were classified as receiving any heart disease treatment if they received one or more medical services (i.e., office-based, hospital outpatient or emergency room visits, hospital inpatient stays, prescribed medicine purchases, or home health services) for heart disease identified by the CCSR categories above as being the reason for or having been discovered while receiving care.
Types of Medical Services
- Office-based visits: Includes expenses for visits to medical providers (i.e., physicians and nonphysicians) seen in office-based settings and clinics during the year. For 2022, this service category also includes telehealth visits (i.e., visits made to medical providers practicing in an office-based setting or clinic over the phone, through real-time video, or some other way).
- Hospital outpatient visits: Includes expenses for services provided by the facility and physicians who bill separately from the facility for visits to hospital outpatient departments during the year. For 2022, this service category also includes telehealth visits (i.e., visits made to medical providers practicing in a hospital outpatient department over the phone, through real-time video, or some other way).
- Emergency room visits: Includes payments for services covered under the basic facility charge and those for separately billed physician services during the year. However, these payments exclude expenses for emergency room services included in an inpatient hospital bill.
- Hospital inpatient stays: Includes room and board and all hospital diagnostic and laboratory expenses associated with the basic facility charge, payments for separately billed physician inpatient services, and some emergency room expenses incurred prior to inpatient stays.
- Prescribed medicines: Includes expenses for all prescribed medications initially purchased or refilled during the year.
- Home health services: Includes expenses for home health services provided by agencies and independent providers during the year.
A sample person is defined as having received a given medical service only if some expenses were reported for the care.
Sources of Payment
- Out-of-pocket: Expenses paid by the user or other family member.
- Private insurance: Payments made by insurance plans covering hospital and medical care (excluding payments from Medicare, Medicaid, and other public sources). Payments from Medigap plans or TRICARE (Armed Forces-related coverage) are included.
- Medicare: Payments by this federally financed health insurance program for persons age 65 and older, persons receiving Social Security disability payments, and individuals with end-stage renal disease.
- Medicaid/Children's Health Insurance Program (CHIP): Payments by Medicaid and CHIP, which are means-tested government programs jointly financed by federal and state funds that provide healthcare to eligible people. Medicaid is designed to provide health coverage to families and individuals who cannot afford necessary medical care, while CHIP provides coverage to additional low-income children not eligible for Medicaid. Eligibility criteria for both programs vary significantly by state.
- Other sources: Includes payments from the U.S. Department of Veterans Affairs; other federal sources (Indian Health Service and other care provided by the federal government, except TRICARE); various state and local sources (community and neighborhood clinics, state and local health departments, and state programs other than Medicaid/CHIP); workers' compensation; and various unclassified sources (e.g., automobile, homeowner's, or other liability insurance, and other miscellaneous or unknown sources).
Expenditures for Heart Disease Treatment
Expenses reported in this Brief were defined as associated with heart disease if a medical visit, stay, service or purchase of a prescribed medicine was for treatment of heart disease. For each event, all expenditures were counted as expenditures for heart disease if the event was reported as associated with heart disease, even if other conditions were also reported. The report aggregates heart disease treatment costs across service categories to create a person-level total for each payment source. It also aggregates heart disease treatment costs at the individual level for each of the six medical services and for all services combined.
Age
Individuals were classified into three age groups (i.e., 18-44, 45-64, and 65 and older). Age was defined as age at the end of the year 2022 (or on last date of MEPS eligibility if the person was out of scope at the end of the year).
Sex
Sex was defined with two mutually exclusive categories as either male or female.
Race/ethnicity
MEPS respondents were asked if each family member was Hispanic or Latino and about each member's race. Based on this information, categories of race and Hispanic origin were constructed as follows:
- Hispanic
- White, non-Hispanic with no other race reported
- Black, non-Hispanic with no other race reported
- Asian, non-Hispanic, with no other race reported
The "other/multiple races, non-Hispanic" category is not shown separately in this Brief due to small sample sizes or failure to meet minimum precision requirements. However, those individuals are included in the overall total.
Family Income
Family Income was classified into the following four categories based on the ratio of total family income to the federal poverty line (FPL), adjusted for family size and composition:
- Poor (less than 125% of FPL)
- Low income (125% to less than 200% of FPL)
- Middle income (200% to less than 400% of FPL)
- High income (greater than or equal to 400% of FPL)
Census Region
Census region (categories shown below) was based on the location of the household at the end of the year. If missing at the end of the year, the location from a previous MEPS data collection round was used.
- Northeast: Maine, New Hampshire, Vermont, Massachusetts, Rhode Island, Connecticut, New York, New Jersey, and Pennsylvania
- Midwest: Ohio, Indiana, Illinois, Michigan, Wisconsin, Minnesota, Iowa, Missouri, North Dakota, South Dakota, Nebraska, and Kansas
- South: Delaware, Maryland, District of Columbia, Virginia, West Virginia, North Carolina, South Carolina, Georgia, Florida, Kentucky, Tennessee, Alabama, Mississippi, Arkansas, Louisiana, Oklahoma, and Texas
- West: Montana, Idaho, Wyoming, Colorado, New Mexico, Arizona, Utah, Nevada, Washington, Oregon, California, Alaska, and Hawaii
About MEPS
The Medical Expenditure Panel Survey Household Component (MEPS-HC) collects nationally representative data on health care use, expenditures, sources of payment, and insurance coverage for the U.S. civilian noninstitutionalized population. The MEPS-HC is cosponsored by the Agency for Healthcare Research and Quality (AHRQ) and the National Center for Health Statistics (NCHS). More information about the MEPS-HC can be found on the MEPS Web site at https://meps.ahrq.gov/.
References
Kochanek, Kenneith D, Sherry L. Murphy, Jiaquan Xu, and Elizabeth Arias. "Mortality in the United States, 2022." National Center for Health Statistics Data Brief, No. 492, March 2024.
For a detailed description of the MEPS-HC survey design, sample design, and methods used to minimize sources of nonsampling error, see the following publication: Cohen, J. Design and Methods of the Medical Expenditure Panel Survey Household Component. MEPS Methodology Report #1. AHCPR Pub. No. 97 0026. July 1997. Agency for Health Care Policy and Research (AHCPR), Rockville, MD. https://meps.ahrq.gov/data_files/publications/mr1/mr1.shtml
Suggested Citation
Moriya, A. S. and Berdahl, T. Healthcare Expenditures for Heart Disease among Adults Aged 18 and Older in the U.S. Civilian Noninstitutionalized Population, 2022. Statistical Brief #562. AHRQ Publication No. 25-0056. July 2025. Agency for Healthcare Research and Quality, Rockville, MD. https://meps.ahrq.gov/data_files/publications/st562/stat562.shtml
Notes
1 These expenditures are the sum of the treatment costs across medical service categories for heart disease, excluding dental visits and other medical equipment and services (e.g., eyeglasses, contact lenses, ambulance services, orthopedic items, hearing devices).
AHRQ welcomes questions and comments from readers of this publication who are interested in obtaining more information about access, cost, use, financing, and quality of healthcare in the United States. We also invite you to tell us how you are using this Statistical Brief and other MEPS data and tools and to share suggestions on how MEPS products might be enhanced to further meet your needs. Please email us at MEPSProjectDirector@ahrq.hhs.govor send a letter to the address below:
Samuel H. Zuvekas, PhD, Acting Director
Center for Financing, Access and Cost Trends
Agency for
Healthcare Research and Quality
5600 Fishers Lane, Mailstop 07W41A
Rockville, MD 20857
Figures
Figure 1. Percentage of adults aged 18 and older who received any heart disease treatment by demographic characteristics, 2022
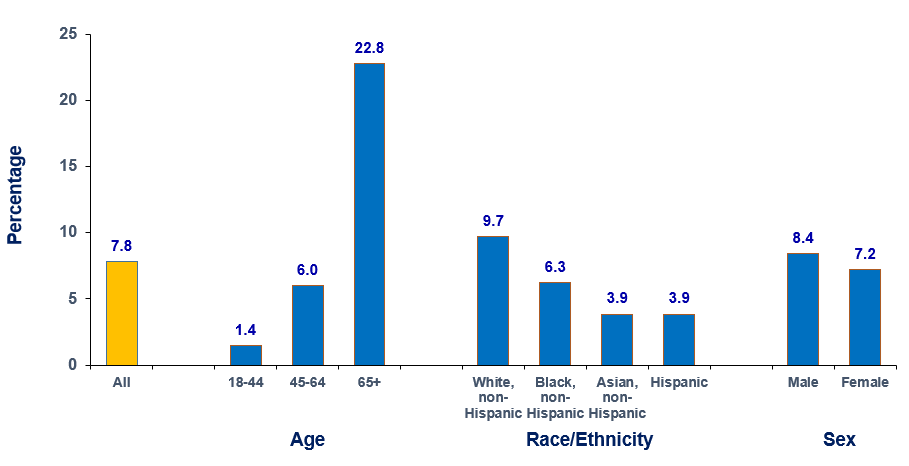
| Category | Subcategory | Percentage |
|---|---|---|
| All | All | 7.8% |
| Age | 18-44 | 1.4% |
| 45-64 | 6.0% | |
| 65+ | 22.8% | |
| Race/Ethnicity | White, non-Hispanic | 9.7% |
| Black, non-Hispanic | 6.3% | |
| Asian, non-Hispanic | 3.9% | |
| Hispanic | 3.9% | |
| Sex | Male | 8.4% |
| Female | 7.2% |
Source: Center for Financing, Access, and Cost Trends, AHRQ, Household Component of the Medical Expenditure Panel Survey, 2022.
Figure 2. Percentage of adults aged 18 and older who received any heart disease treatment by income and region, 2022
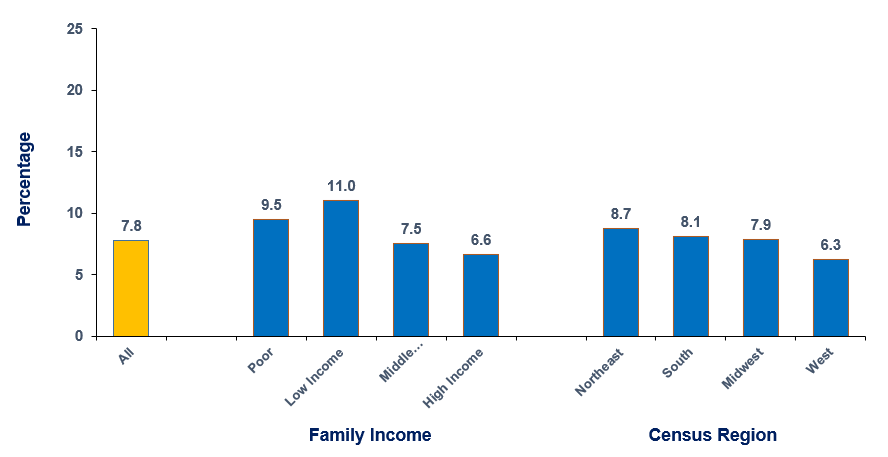
| Category | Subcategory | Percentage |
|---|---|---|
| All | All | 7.8% |
| Family Income | Poor | 9.5% |
| Low Income | 11.0% | |
| Middle Income | 7.5% | |
| High Income | 6.6% | |
| Census Region | Northeast | 8.7% |
| South | 8.1% | |
| Midwest | 7.9% | |
| West | 6.3% |
Source: Center for Financing, Access, and Cost Trends, AHRQ, Household Component of the Medical Expenditure Panel Survey, 2022.
Figure 3. Percentage who received various medical services among adults aged 18 and older treated for heart disease, 2022
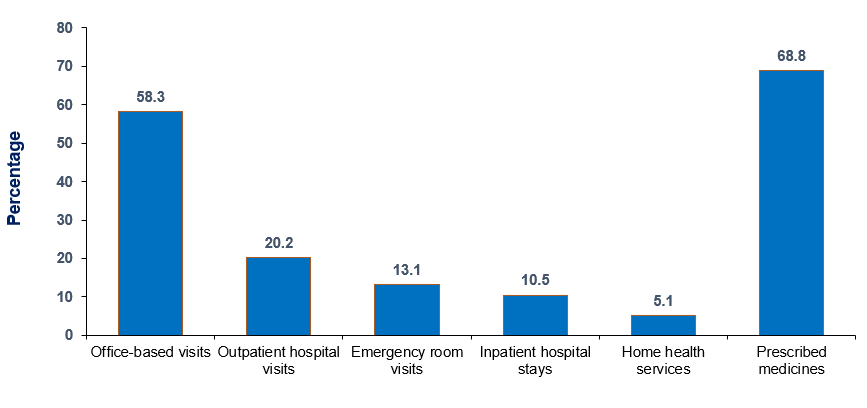
| Category | Percentage |
|---|---|
| Office-based visits | 58.3% |
| Outpatient hospital visits | 20.2% |
| Emergency room visits | 13.1% |
| Inpatient hospital stays | 10.5% |
| Home health services | 5.1% |
| Prescribed medicines | 68.8% |
Source: Center for Financing, Access, and Cost Trends, AHRQ, Household Component of the Medical Expenditure Panel Survey, 2022.
Figure 4. Mean expenditures per person and median expenditures for heart disease treatment, overall and by type of medical service, among adults aged 18 and older treated for heart disease, 2022
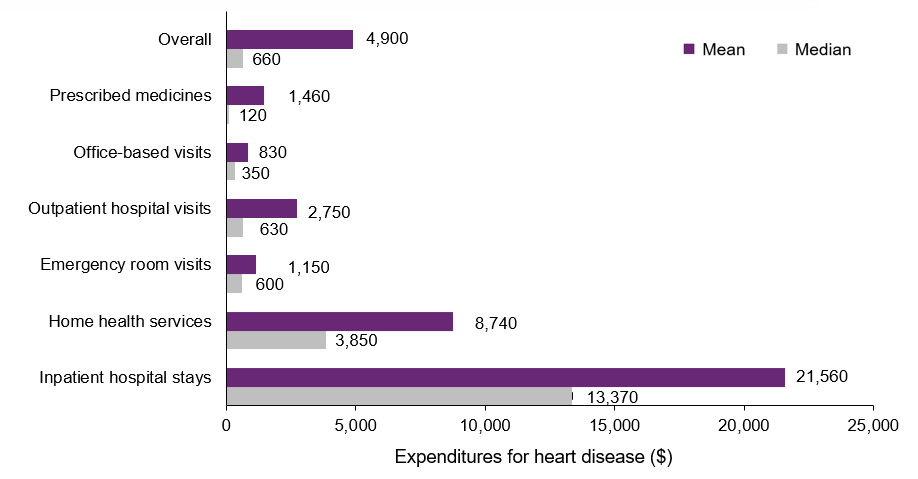
| Category | Mean Expenditure | Median Expenditure |
|---|---|---|
| Overall | $4,900 | $660 |
| Prescribed medicines | $1,460 | $120 |
| Office-based visits | $830 | $350 |
| Outpatient hospital visits | $2,750 | $630 |
| Emergency room visits | $1,150 | $600 |
| Home health services | $8,740 | $3,850 |
| Inpatient hospital stays | $21,560 | $13,370 |
Note: The estimates are rounded to the nearest ten dollars.
Source: Center for Financing, Access, and Cost Trends, AHRQ, Household
Component of the Medical Expenditure Panel Survey, 2022.
Figure 5. Percent distribution of heart disease treatment expenses by type of medical service among adults aged 18 and older treated for heart disease, 2022
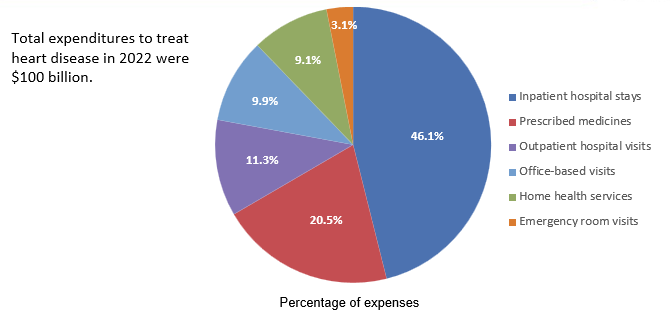
| Category | Percentage of expenses |
|---|---|
| Inpatient hospital stays | 46.1% |
| Prescribed medicines | 20.5% |
| Outpatient hospital visits | 11.3% |
| Office-based visits | 9.9% |
| Home-health services | 9.1% |
| Emergency-room visits | 3.1% |
Source: Center for Financing, Access, and Cost Trends, AHRQ, Household Component of the Medical Expenditure Panel Survey, 2022.
Figure 6. Percent distribution of heart disease treatment expenses by source of payment among adults aged 18 and older treated for heart disease, 2022
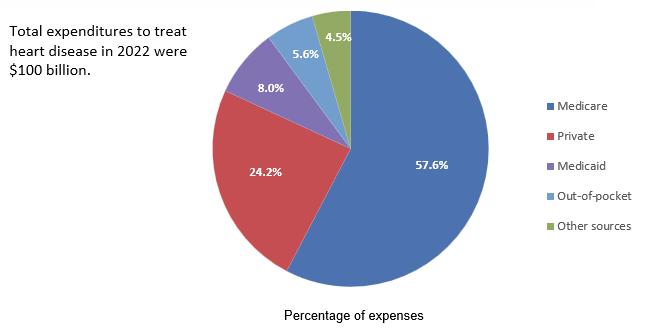
| Category | Percentage of expenses |
|---|---|
| Medicare | 57.6% |
| Private | 24.2% |
| Medicaid | 8.0% |
| Out-of-pocket | 5.6% |
| Other sources | 4.5% |
Note: Percentages do not add to exactly 100% due to rounding.
Source: Center for Financing, Access, and Cost Trends, AHRQ, Household
Component of the Medical Expenditure Panel Survey, 2022.
AHRQ Pub. No. 25-0056
July 2025