
|
|
|
Font Size:
|
||||
|
|
|
|
||||
Adult Ratings of Neighborhood Medical Care Availability in Nonmetropolitan and Metropolitan Areas, United States 2021
Statistical Brief #564 | July 2025 | Sandra L. Decker, Ph.D. and Xue Wu, Ph.D.
Highlights
- About 17.7 percent of adults in nonmetropolitan areas consider the availability of medical care in their neighborhood to be fair or poor, compared to only 8.2 percent of adults in metropolitan areas.
- Over one-quarter (25.4%) of adults in small rural areas consider medical care availability to be fair or poor compared to only 14.0 percent in large rural areas, 8.6 percent in suburban areas, and 8.1 percent in urban areas.
- In the United States as a whole, more adults with Medicaid health insurance coverage (16.5%) and who were uninsured (18.4%) consider medical care availability to be fair or poor compared to 7.6 percent of those with private insurance and 8.4 percent of those with Medicare.
- Nearly one-third (31.5%) of adults on Medicaid living in small rural areas consider medical care availability to be only fair or poor compared to less than 14.8 percent of adults with Medicaid living in urban areas.
- Nearly 59 percent of uninsured adults in small rural areas report medical care availability to be only fair or poor compared to 16.9 percent of uninsured adults in urban areas.
- Nearly one-in-five adults (18.6%) in only fair or poor health report limited health care availability compared to 8.3 percent of adults in good or better health.
- Over 42 percent of adults in small rural areas with fair or poor health report limited access to care compared to only 15.9 percent of adults in fair or poor health living in urban areas.
Introduction
Reducing the impact of chronic disease among U.S. adults is a major goal of the President's Make America Healthy Again Commission.1 Understanding how U.S. adults view medical care availability may provide insights into any difficulties Americans have in accessing healthcare services to prevent or manage chronic disease. While national measures of access to healthcare often focus on provider counts and degree of health insurance coverage, consumer perceptions of medical care access may reflect not just the physical presence of clinics or hospitals, but also the experience of trying to get care and how those experiences may be influenced by wait times (either to get appointments or while in the office), service hours, transportation difficulties, or lack of trust in local providers. These perceptions may be particularly important in rural areas since rural areas bear the greatest burden of chronic disease, especially lifestyle-related chronic disease.2
Rural residents may face greater challenges in accessing preventive and other medical care due to provider shortages,3 greater distances to care,4 and fewer specialty services. This is especially concerning since rural communities have been found to have higher age-adjusted mortality rates compared to more urban areas.5 Other factors, such as insurance type, health status, age, sex, and race/ethnicity also influence how people assess their local healthcare landscape. Identifying which groups report most difficulty accessing care—and where those gaps are most pronounced—can inform efforts to target interventions.
This report uses data collected from the Agency for Healthcare Research and Quality's (AHRQ's) 2021 Medical Expenditure Panel Survey Household Component (MEPS-HC), including its Social and Health Experiences Self-Administered Questionnaire. The analysis is based on completed responses among all adults aged 18 and over in the U.S. civilian noninstitutionalized population. Unless noted, all differences mentioned in the text are significant at the p<0.05 level or better.
Findings
Overall ratings (figure 1)
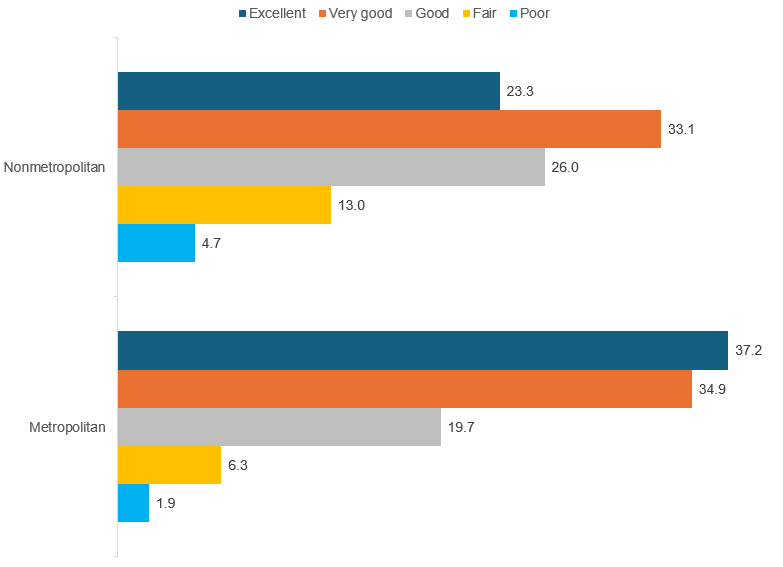
In 2021, adults living in metropolitan areas were more likely to rate the availability of places to get medical care in their neighborhoods positively compared to those in nonmetropolitan areas. Specifically, 37.2 percent of adults living in metropolitan areas rated health care access as excellent and 34.9 percent as very good, while only 8.2 percent rated it fair or poor. In contrast, residents of nonmetropolitan areas reported lower satisfaction with healthcare access. Only 23.3 percent rated access as excellent and 33.1 percent as very good. About 17.7 percent rated it as fair or poor.
Fair or poor ratings (figure 2)
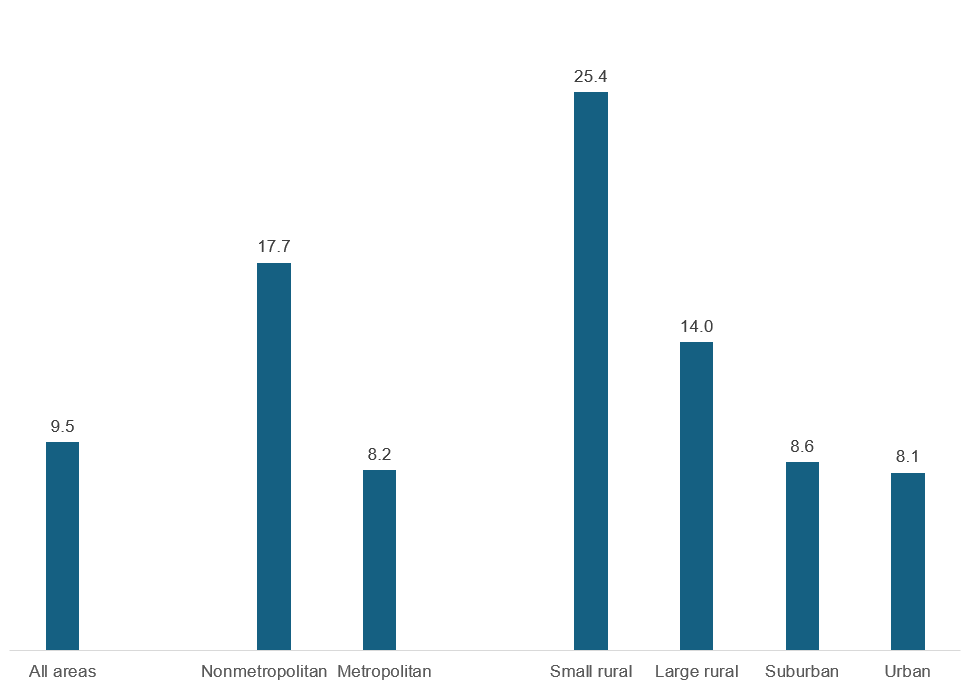
Metropolitan areas can be subdivided into urban and suburban areas, and nonmetropolitan areas can be subdivided into large and small rural areas. A closer look at rural subcategories reveals even greater differences: 25.4 percent of adults in small rural areas rated access as fair or poor—the highest among all groups—followed by 14.0 percent in large rural areas. In contrast, only 8.6 percent of suburban and 8.1 percent of urban residents shared this view.
Age group (figure 3)
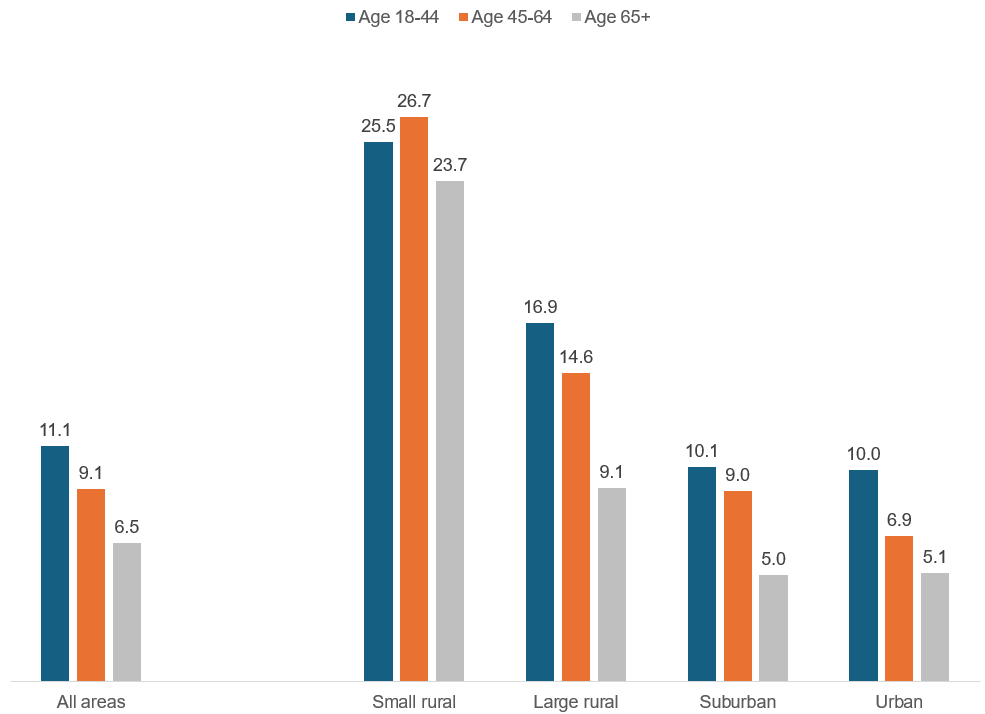
For the United Sates as a whole, and for areas other than small rural, there was a clear age gradient, with adults in younger groups reporting more dissatisfaction compared to those in older age groups. For example, in large rural areas, 16.9 percent of adults aged 18-44 reported availability of medical care to be only fair or poor compared to 14.6 percent of adults aged 45-64 and 9.1 percent of adults aged 65+. In small rural areas, the pattern of satisfaction with medical care availability by age group was less clear and differences were not statistically significant. However, adults of all ages living in small rural areas reported greater dissatisfaction with medical care availability compared to those in more urban areas.
Race/Ethnicity (figure 4)
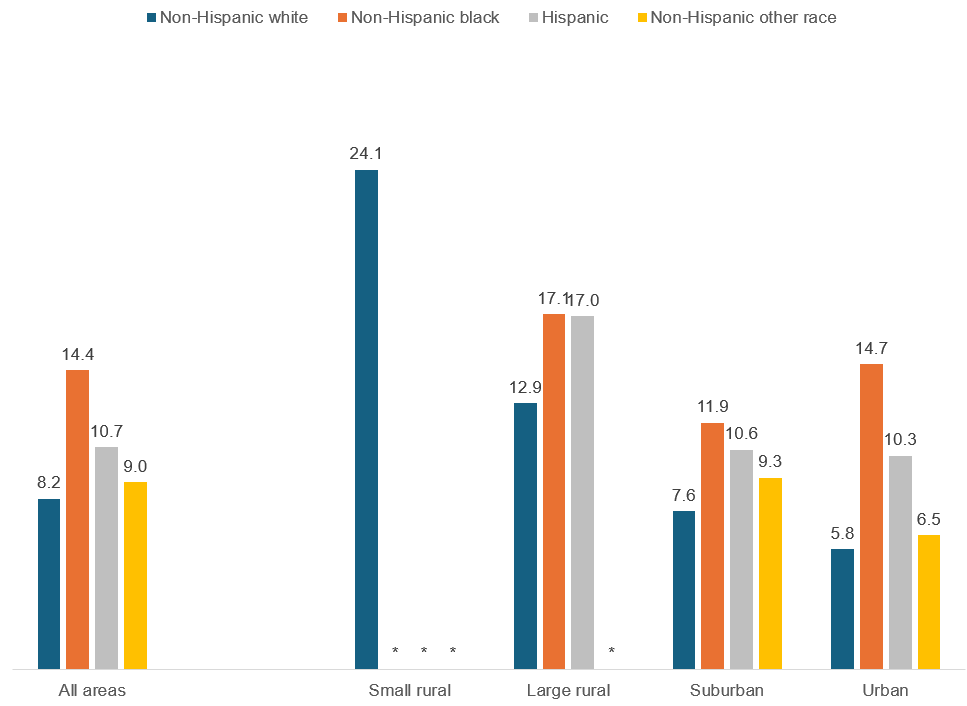
For the United States as a whole, non-Hispanic black and Hispanic adults were more likely to report healthcare availability to be only fair or poor compared to non-Hispanic white adults. About 14.4 percent of non-Hispanic black adults and 10.7 percent of Hispanic adults in the United States rated availability as only fair or poor compared to only 8.2 percent among non-Hispanic white adults. However, nearly one-quarter (24.1%) of non-Hispanic white adults in small rural areas reported medical care availability to be only fair or poor, a high rate of dissatisfaction compared to non-Hispanic white adults in more urban areas.
Insurance status (figure 5)
Across all types of areas, adults with Medicaid coverage and the uninsured reported more problems with medical care availability compared to those with private insurance or Medicare. About 16.5 percent of adults with Medicaid and 18.4 percent of adults who were uninsured reported problems with medical care availability compared to 7.6 percent of privately insured adults and 8.4 percent of those with Medicare. Rates of concern with healthcare availability among those on Medicaid or uninsured were greatest in rural areas. For example, nearly 59 percent of uninsured adults in small rural areas reported availability of medical care to be fair or poor compared to only 16.9 percent of uninsured adults in urban areas. Nearly one-third (31.5%) of adults on Medicaid and living in small rural areas reported medical care availability to be only fair or poor compared to less than 15 percent of adults on Medicaid in urban areas. Levels of satisfaction with healthcare availability were not statistically significantly different for adults with Medicare compared to those with private insurance in any area.
Physical health status (figure 6)
Adults in fair or poor physical health were more likely than those in better health to report that the availability of neighborhood medical care was only fair or poor. Adults in only fair or poor health and living in small rural areas were particularly likely to report dissatisfaction with medical care availability. Over 42 percent of adults in small rural areas with only fair or poor health reported limited access to care, compared to 20.6 percent of those in good or better health living in small rural areas and 15.9 percent of those in only fair or poor health living in urban areas.
Data Source
This Statistical Brief used data from the 2021 Medical Expenditure Panel Survey (MEPS) Full-Year Consolidated Data File (HC-233). The question about neighborhood availability of medical care came from the 2021 MEPS Social and Health Experiences Self-Administered Questionnaire (https://meps.ahrq.gov/survey_comp/survey.jsp), a multimode supplement fielded in spring 2021, with follow-up for nonresponse in fall 2021.6 Data are publicly available from this site: https://meps.ahrq.gov/data_stats/download_data_files.jsp. Due to confidentiality concerns, urban-rural designations for MEPS households are not on public use files but may be accessed for approved projects through the AHRQ Research Data Center (https://meps.ahrq.gov/mepsweb/data_stats/onsite_datacenter.jsp).
Definitions
Neighborhood availability of medical care
The supplement asked adults to rate (excellent, very good, good, fair, poor) the characteristics of their neighborhood, including the availability of places to get medical care. (SDMEDCARE)
Age
Age was categorized based on the age around the time the supplement was initiated. (AGE31X)
Race/Ethnicity
Classification by race/ethnicity was based on information reported for each family member. First, respondents were asked if the person's main national origin or ancestry was Puerto Rican; Cuban; Mexican, Mexican American, or Chicano; other Latin American; or other Spanish. All people whose main national origin or ancestry was reported in one of these Hispanic groups, regardless of racial background, were classified as Hispanic. All other people were classified according to their reported race. For this analysis, the following classification by race and ethnicity was used: Hispanic, non-Hispanic Black, non-Hispanic White, and non-Hispanic other. The "other" category included American Indian, Alaska Native, Asian or Pacific Islander, other race, and multiple races. (RACEV1X, HISPANX)
Metropolitan and nonmetropolitan areas
Metropolitan status was determined based on the respondent's county of residence around the time the supplement was initiated matched with the relevant urban-rural continuum code.7 Metropolitan areas include a core urban population of 50,000 or more and are further divided into urban (urban-rural continuum code 1) and suburban (codes 2-3) areas. Nonmetropolitan areas, considered rural, include all counties outside metropolitan boundaries. They are categorized as large rural (codes 4-6) and small rural (codes 7-19).
Insurance coverage
- Any private: Person had any private insurance coverage, including TRICARE/CHAMPVA, any time during 2021. If a person had both public and private insurance, this person is classified as having private insurance coverage. (INSCOV21)
- Medicare: Person had only public health insurance coverage during all of 2021 and had Medicare coverage in at least one month in 2021. (INSCOV21, MCRJA21- MCRDE21)
- Medicaid: Person had only public health insurance coverage during all of 2021 and had no Medicare coverage in any month in 2021. (INSCOV21, MCRJA21- MCRDE21)
- Uninsured: Person was uninsured during all of 2021. (INSCOV21)
Perceived health status
The MEPS respondent was asked to rate the health of each person in the family around the time the supplement was initiated according to the following categories: excellent, very good, good, fair, and poor. (RTHLTH31)
About MEPS
The MEPS-HC collects nationally representative data on healthcare use, expenditures, sources of payment, and insurance coverage for the U.S. civilian noninstitutionalized population. The MEPS-HC is cosponsored by AHRQ and the National Center for Health Statistics. More information about the MEPS-HC can be found on the MEPS website at https://meps.ahrq.gov/.
For a detailed description of the MEPS-HC survey design, sample design, and methods used to minimize sources of nonsampling error, see the following publications:
Cohen J. Design and Methods of the Medical Expenditure Panel Survey Household Component. MEPS Methodology Report No. 1. Agency for Health Care Policy Research Pub. No. 97-0026. Rockville, MD: Agency for Health Care Policy and Research; 1997. https://meps.ahrq.gov/data_files/publications/mr1/mr1.pdf.
Cohen S. Sample Design of the 1996 Medical Expenditure Panel Survey Household Component. MEPS Methodology Report No. 2. Agency for Health Care Policy and Research Pub. No. 97-0027. Rockville, MD: Agency for Healthcare Research and Quality, 1997. https://meps.ahrq.gov/data_files/publications/mr2/mr2.pdf
References
1 The White House. Establishing the President's Make America Healthy Again Commission. https://www.whitehouse.gov/presidential-actions/2025/02/establishing-the-presidents-make-america-healthy-again-commission/. Accessed April 25, 2025.
2 Smith SA, Ansa B. 2016. A Systemic Review of Lifestyle Interventions for Chronic Diseases in Rural Areas. Journal of the Georgia Public Health Association. 5(4): 1-15.
3 Goins RT, Williams KA, Carter MW, Spencer SM, Solovieva T. 2005. Perceived Barriers to Health Care Access Among Rural Older Adults: A Qualitative Study. The Journal of Rural Health. 21(3):206-213.
4 Decker SL, Gourevitch RA, Meille G. 2024. Patient Travel Patterns and Concordance with Geographic Market Boundaries. Annals of Internal Medicine. 177(12): 1732-1734.
5 Moy E, Garcia MC, Bastian B et al. 2017. Leading Cases of Death in Nonmetropolitan and Metropolitan Areas - United States, 1999-2014. Morbidity and Mortality Weekly. 66(1): 1-8.
6 Kistler A, Decker S, Steiger D, Novik J. 2024. A Multimode Strategy to Contact Participants and Collect Responses in a Supplement to a Longitudinal Household Survey. Survey Methods: Insights from the Field. 2(1). 2024; https://surveyinsights.org/?p=18357. Accessed April 25, 2025.
7 U.S. Department of Agriculture. 2013 Rural-Urban Continuum Codes. https://www.ers.usda.gov/data-products/rural-urban-continuum-codes. Accessed May 14, 2025.
Suggested Citation
Decker, S.L. and Wu X. Adult Ratings of Neighborhood Medical Care Availability in Nonmetropolitan and Metropolitan Areas, United States 2021. Statistical Brief #564. AHRQ Publication No. 25-0061. July 2025. Agency for Healthcare Research and Quality, Rockville, MD. https://meps.ahrq.gov/data_files/publications/st564/stat564.shtml
AHRQ welcomes questions and comments from readers of this publication who are interested in obtaining more information about access, cost, use, financing, and quality of healthcare in the United States. We also invite you to tell us how you are using this Statistical Brief and other MEPS data and tools and to share suggestions on how MEPS products might be enhanced to further meet your needs. Please email us at MEPSProjectDirector@ahrq.hhs.govor send a letter to the address below:
Samuel H. Zuvekas, PhD, Acting Director
Center for Financing, Access and Cost Trends
Agency for
Healthcare Research and Quality
5600 Fishers Lane, Mailstop 07W41A
Rockville, MD 20857
Figures
Figure 1. U.S. 2021 Adult Ratings of Neighborhood Availability of Places to Get Medical Care - Percent of Adults
| Neighborhood Type | Excellent | Very Good | Good | Fair | Poor |
|---|---|---|---|---|---|
| Nonmetropolitan | 23.3 | 33.1 | 26.0 | 13.0 | 4.7 |
| Metropolitan | 37.2 | 34.9 | 19.7 | 6.3 | 1.9 |
Note: Percentages may not add to exactly 100% due to rounding.
Source: Agency for Healthcare Research and Quality, Medical Expenditure Panel Survey,
Household Component, 2021.
Figure 2. Percent of U.S. Adults Rating Neighborhood Availability of Places to Get Medical Care as Only Fair or Poor
| Neighborhood Type | Percent with rating of fair or poor |
|---|---|
| All areas | 9.5 |
| Nonmetropolitan | 17.7 |
| Metropolitan | 8.2 |
| Small rural | 25.4 |
| Large rural | 14.0 |
| Suburban | 8.6 |
| Urban | 8.1 |
Source: Agency for Healthcare Research and Quality, Medical Expenditure Panel Survey, Household Component, 2021.
Figure 3. Percent of U.S. Adults Rating Neighborhood Availability of Places to Get Medical Care as Only Fair or Poor: By Age Group
| Neighborhood Type | Age 18–44 | Age 45–64 | Age 65+ |
|---|---|---|---|
| All areas | 11.1 | 9.1 | 6.5 |
| Small rural | 25.5 | 26.7 | 23.7 |
| Large rural | 16.9 | 14.6 | 9.1 |
| Suburban | 10.1 | 9.0 | 5.0 |
| Urban | 10.0 | 6.9 | 5.1 |
Source: Agency for Healthcare Research and Quality, Medical Expenditure Panel Survey, Household Component, 2021.
Figure 4. Percent of U.S. Adults Rating Neighborhood Availability of Places to Get Medical Care as Only Fair or Poor: By Race/Ethnicity
| Neighborhood Type | Non-Hispanic white | Non-Hispanic black | Hispanic | Non-Hispanic other race |
|---|---|---|---|---|
| All areas | 8.2 | 14.4 | 10.7 | 9.0 |
| Small rural | 24.1 | * | * | * |
| Large rural | 12.9 | 17.1 | 17.0 | * |
| Suburban | 7.6 | 11.9 | 10.6 | 9.3 |
| Urban | 5.8 | 14.7 | 10.3 | 6.5 |
Note: * Data point suppressed since the relative standard error of the estimate is greater than 30 percent.
Source: Agency for Healthcare Research and Quality, Medical Expenditure Panel Survey,
Household Component, 2021.
Figure 5. Percent of U.S. Adults Rating Neighborhood Availability of Places to Get Medical Care as Only Fair or Poor: By Insurance Status
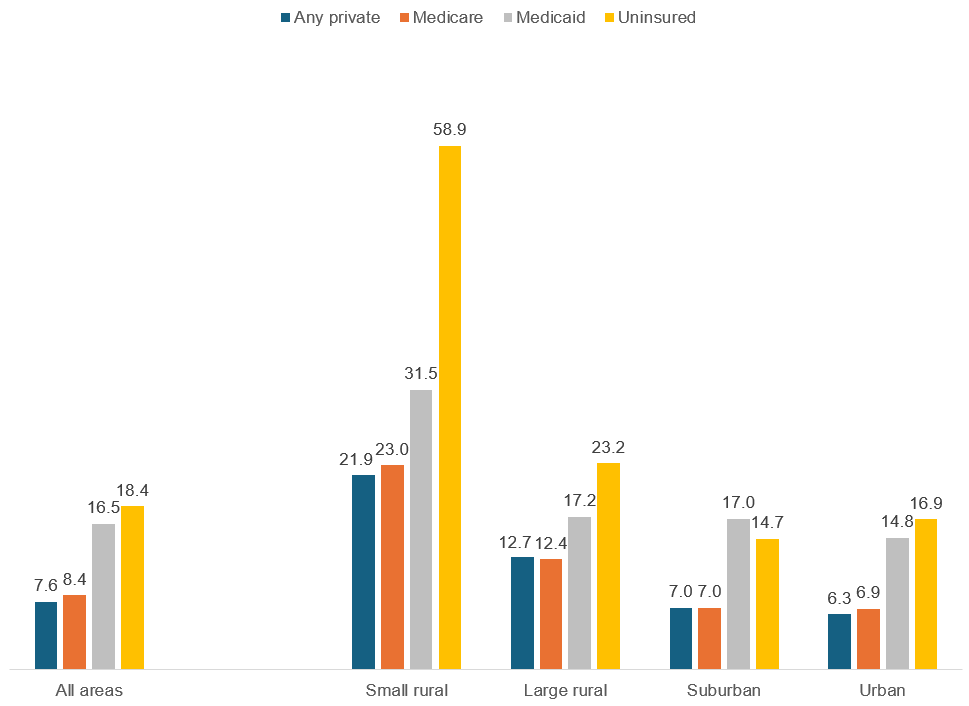
| Neighborhood Type | Any private | Medicare | Medicaid | Uninsured |
|---|---|---|---|---|
| All areas | 7.6 | 8.4 | 16.5 | 18.4 |
| Small rural | 21.9 | 23.0 | 31.5 | 58.9 |
| Large rural | 12.7 | 12.4 | 17.2 | 23.2 |
| Suburban | 7.0 | 7.0 | 17.0 | 14.7 |
| Urban | 6.3 | 6.9 | 14.8 | 16.9 |
Source: Agency for Healthcare Research and Quality, Medical Expenditure Panel Survey, Household Component, 2021.
Figure 6. Percent of U.S. Adults Rating Neighborhood Availability of Places to Get Medical Care as Only Fair or Poor: By Physical Health Status
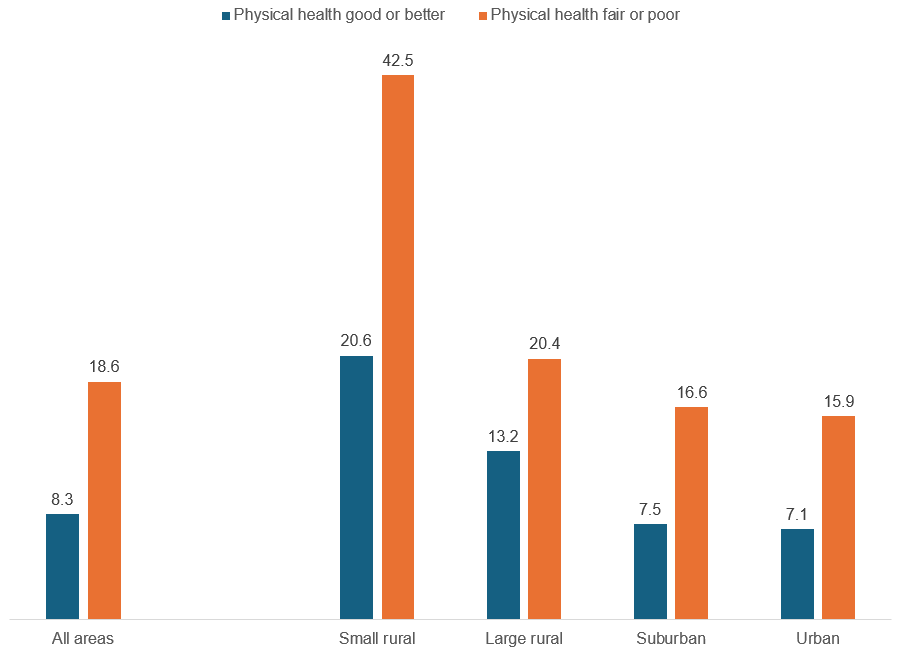
| Neighborhood Type | Physical health good or better | Physical health fair or poor |
|---|---|---|
| All areas | 8.3 | 18.6 |
| Small rural | 20.6 | 42.5 |
| Large rural | 13.2 | 20.4 |
| Suburban | 7.5 | 16.6 |
| Urban | 7.1 | 15.9 |
Source: Agency for Healthcare Research and Quality, Medical Expenditure Panel Survey, Household Component, 2021.
AHRQ Pub. No. 25-0061
July 2025