
|
|
|
Font Size:
|
||||
|
|
|
|
||||
Treatment and Health Expenditures among Children with Autism Spectrum Disorder, U.S. Civilian Noninstitutionalized Population, 2018-2022
Statistical Brief #565 | August 2025 | Jessica Monnet, PhD & Samuel H. Zuvekas, PhD
Highlights
- Treated Autism Spectrum Disorder (ASD) was three times more common among male children than female children.
- 69.8 percent of average total health expenditures for children with treated ASD can be attributed to ASD-specific expenditures.
- Home healthcare represented approximately one-third of the average total health expenditures for children with treated ASD.
- Average total health expenditures declined with age for children with treated ASD.
Introduction
Autism Spectrum Disorder (ASD) is a neurodevelopmental disorder that affects how a person interacts and communicates with others and is characterized by restricted, repetitive patterns of behavior or interests.1 While the progression of ASD varies from child to child, the onset of ASD symptoms tends to be observed in the second year of a child's life, with diagnosis occurring later in childhood.1,2 Between 2011 and 2022, the diagnosis rate of ASD increased, by 207 percent and 143 percent for children 5 to 8 years (30.3 per 1,000 children) and 9 to 12 years (22.1 per 1,000 children), respectively.2 As the prevalence of ASD increases, so do concerns about the associated treatment costs.
This statistical brief reports the average annual percent treated for ASD and average total health expenditures for children (3 to 17 years) with and without treated ASD. It is important to note that prior studies find that approximately one-third of children with a current ASD diagnosis will not receive treatment (either medication or behavioral).3,4 This statistical brief also excludes behavioral treatment provided in school-based and institutional settings. The analysis relies on data from the Full-Year Consolidated files for the Household Component of the Medical Expenditure Panel Survey (MEPS-HC), as well as the Medical Conditions, Prescribed Medicines, Hospital Inpatient Stays, Emergency Room Visits, Outpatient Visits, Office-Based Medical Provider visits, and Home Health Event files. To ensure a sufficient sample size, we pooled data from 2018 through 2022.5 Differences reported in the text are statistically significant at the 5 percent level or higher.
Findings
Prevalence of Autism Spectrum Disorder
Table 1 presents the average annual percent of children aged 3 to 17 who were treated for ASD between 2018 and 2022. During that time, the percent of children treated for ASD was 1.2 percent and was three times more common among male children (1.9%) than female children (0.6%). The annual percent of children treated for ASD was comparable across other characteristics, such as age, insurance status, and poverty level.
Health Expenditures
Table 2 presents average total health expenditures for children with and without treated ASD between 2018 and 2022. Children with treated ASD had greater average total health expenditures (mean = $20,122; median = $7,427) than children without treated ASD (mean = $2,201; median = $564). The latter group (children without treated ASD) likely includes children with an ASD diagnosis but no reported ASD-related healthcare events. For children with treated ASD, $14,048 (or 69.8%) of their average total expenditures can be attributed to ASD-specific health expenditures.
The subsequent tables and figures present average total health expenditures for children with and without treated ASD between 2018 and 2022, stratified by service category, sex, age group, insurance status, and poverty level.
Health Expenditures by Service Category
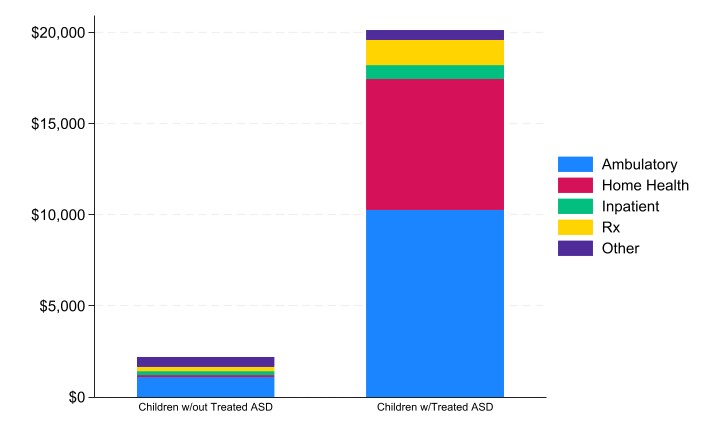
Table 3 and Figure 1 present average total health expenditures by service category (i.e., ambulatory care, home healthcare, inpatient care, prescription drugs, and other). Ambulatory care accounted for 51.0 percent (or $10,279) and 50.0 percent (or $1,101) of average total health expenditures for children with and without treated ASD, respectively. Home healthcare was another significant contributor to the average total health expenditures of children with treated ASD, representing 35.6 percent (or $7,168) of their average total expenditures. In comparison, home healthcare represented 4.6 percent (or $102) of average total health expenditures for children without treated ASD.
Health Expenditures by Sex
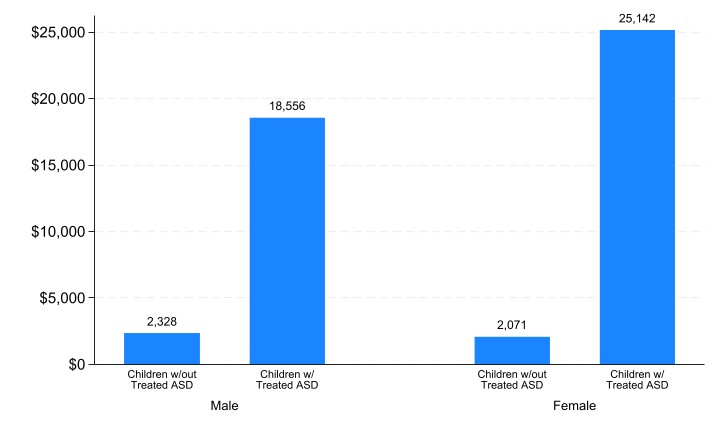
Table 4 and Figure 2 present average total health expenditures by sex. Average total health expenditures for female ($25,142) and male children ($18,556) with treated ASD are not statistically different. In contrast, female children without treated ASD had lower average total health expenditures ($2,071) than male children without treated ASD ($2,328).
Health Expenditures by Age
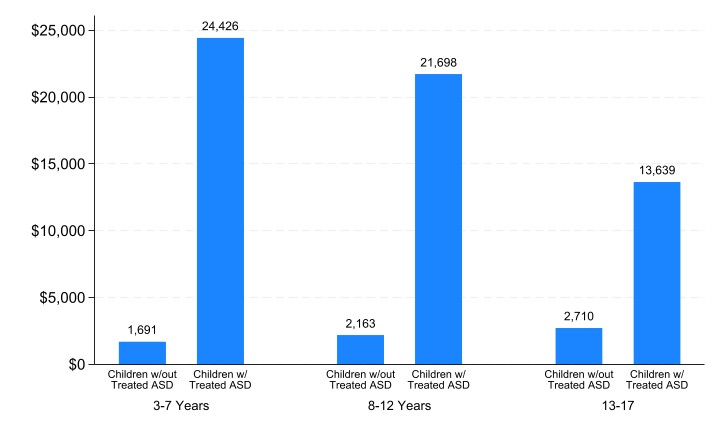
Table 5 and Figure 3 present average total health expenditures stratified by age group (i.e., 3-7, 8-12, and 13-17 years). Average total health expenditures decreased with age for children with treated ASD, declining from $24,416 at 3-7 years to $13,639 at 13-17 years. The opposite relationship was observed for children without treated ASD, whose average total health expenditures increased from $1,691 at 3-7 years to $2,710 at 13-17 years.
Health Expenditures by Insurance Status
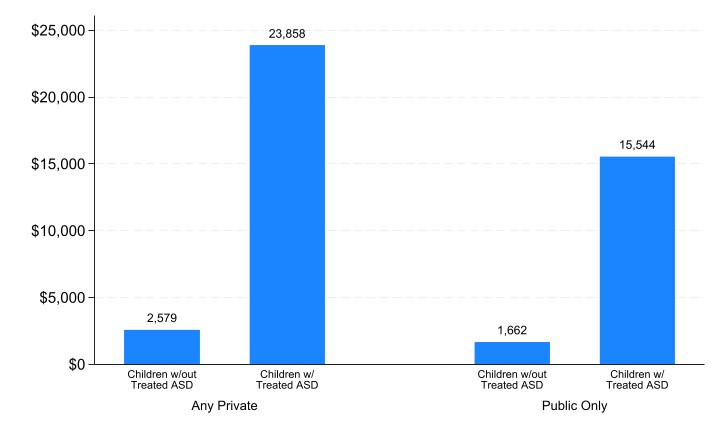
Table 6 and Figure 4 present average total health expenditures by insurance status (i.e., any private, public only, and uninsured). While average total health expenditures for any private exceeds those of public only, the difference is not statistically significant. Among children without treated ASD, average total health expenditures associated with public only ($1,662) health insurance were lower than those associated with any private ($2,579) health insurance. We are unable to report uninsured estimates due to insufficient sample size.
Health Expenditures by Poverty Level
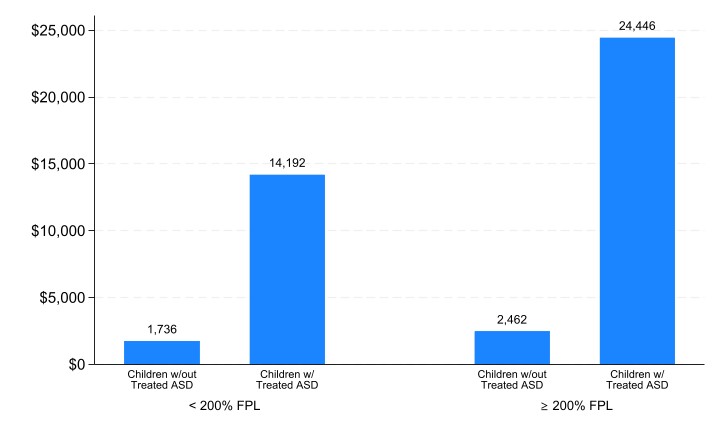
Table 7 and Figure 5 present average total health expenditures by poverty level (i.e., < 200% FPL and ≥ 200% FPL). Average total health expenditures were greater for children with treated ASD and household income ≥ 200% FPL ($24,446) than for children with treated ASD and household income < 200% FPL ($14,192). The same pattern was observed for children without treated ASD.
Limitations
This statistical brief relies on a definition of treated ASD that excludes children with an ASD diagnosis but no reported ASD-related healthcare events, school-based ASD services, and services provided in institutionalized settings. This limitation has two implications for our estimates. First, the average annual percent of children 3-17 with treated ASD (1.2%) reported in this brief is lower than the average annual percent of children 0-17 with diagnosed ASD (2.4%).2 Second, average total health expenditures for children diagnosed with ASD are likely lower than average total health expenditures for children with treated ASD because not all children diagnosed with ASD are treated.4
Data Source
The estimates shown in this Statistical Brief are based on data from the following MEPS 2018 - 2022 Files: (a) Full Year Consolidated Files (HC-209, HC-216, HC-224, HC-233, and HC-243), (b) Medical Conditions file (HC-207, HC-214, HC-222, HC-231, and HC-241), (c) Condition-Event Link File (HC-206IF1, HC-213IF1, HC-220IF1, HC-229IF1, HC-239IF1), (d) Office-Based Medical Provider Visits File (HC-206G, HC-213G, HC-220G, HC-229G, and HC-239G), (e) Outpatient Visits File (HC-206F, HC-213F, HC-220F, HC-229F, and HC-239F), (f) Emergency Room Visits File (HC-206E, HC-213E, HC-220E, HC-229E, and HC-239E), (g) Prescribed Medicines File (HC-206A, HC-213A, HC-220A, HC-229A, and HC-239A), (h) Hospital Inpatient Stays File (HC-206D, HC-213D, HC-220D, HC-229D, and HC-239D), and (i) Home Health File (HC-206H, HC-213H, HC-220H, HC-229H, and HC-239H). These data files are publicly available at https://meps.ahrq.gov/data_stats/download_data_files.jsp.
Definitions
Autism Spectrum Disorder
Children were classified as treated for Autism Spectrum Disorder (ASD) if they had one or more healthcare events (i.e., office-based, hospital outpatient or emergency room visits, hospital inpatient stays, prescribed medicine fills, or home healthcare) where ASD was reported as leading to or having been discovered during the event. Conditions reported by the household were coded into International Classification of Diseases, 10th Revision, Clinical Modification (ICD-10-CM) codes. An ICD-10 code of F84 was used to identify ASD-related events. This definition excludes children with an ASD diagnosis but no reported ASD-related healthcare events. It also excludes school-based ASD services and services provided in institutionalized settings.
Age
Age was defined as age at the end of the year 2022 (or on last date of MEPS eligibility if the person was out of scope at the end of the year).
Expenditures
Total expenditures were defined as the annual sum of payments from all sources to hospitals, physicians, other healthcare providers (including dental care), and pharmacies for services reported by respondents in the MEPS-HC. All dollars were inflated to 2022 levels using the CMS Office of the Actuary Personal Health Care Index price index (see https://meps.ahrq.gov/about_meps/Price_Index.shtml for more details).
Insurance coverage
Any private insurance: A child had any private insurance coverage, including TRICARE/CHAMPVA, if they were covered at any point during the calendar year. If a child had both public and private insurance, the child was classified as having private insurance coverage (INSCOVyy==1).
Public Insurance Only: Public insurance only is defined for children for whom the only source of insurance coverage is TRICARE, Medicare, Medicaid, SCHIP, or other public hospital/physician programs. IHS is not included as a public source of coverage (INSCOVyy==2).
Uninsured: Uninsured is defined as children who were not covered by TRICARE (Armed Forces-related coverage), Medicare, Medicaid, SCHIP, other public hospital/physician insurance, private hospital/physician insurance (including Medigap plans), or Veterans Administration (VA). IHS is not included as a source of coverage (INSCOVyy==3).
Income
Income was classified into the following two categories based on the ratio of total family income to the federal poverty line (FPL), adjusted for family size and composition:
- Poor/low income (less than 200 percent of FPL)
- Middle/high income (200 percent and above of FPL)
Type of service
Ambulatory: Includes office-based visits (visits to medical providers seen in office settings), hospital outpatient visits, and emergency room visits. Expenses for outpatient and emergency room visits include payments for services covered under the basic facility charge and those for separately billed physician services. Emergency room payments exclude expenses for emergency room services that are included in a hospital inpatient admission.
Hospital inpatient: Includes room and board and all hospital diagnostic and laboratory expenses associated with the basic facility charge, payments for separately billed physician inpatient services, and some emergency room expenses incurred immediately prior to inpatient stays.
Prescribed medicines: Includes expenses for all prescribed medications that were initially purchased or refilled during the year.
Home health: Includes expenses for home care provided by agencies and independent providers.
Dental and other: Includes payments for services to any type of dental care provider as well as expenses for care in all categories not specified as a separate category (e.g., vision aids, medical equipment and supplies).
About MEPS-HC
The MEPS-HC is a nationally representative survey that collects detailed information on healthcare utilization and expenditures, health insurance, and health status, as well as a wide variety of social, demographic, and economic characteristics for the U.S. civilian noninstitutionalized population. The MEPS-HC is cosponsored by the Agency for Healthcare Research and Quality (AHRQ) and the National Center for Health Statistics (NCHS). More information about the MEPS-HC can be found at https://meps.ahrq.gov/.
References
The following methodology reports contain information on the survey and sample designs for the MEPS Household and Medical Provider Components (HC and MPC, respectively). Data collected in these two components are jointly used to derive MEPS health care expenditure data.
Cohen, J. Design and Methods of the Medical Expenditure Panel Survey Household Component. MEPS Methodology Report No. 1. AHCPR Pub. No. 97-0026. Rockville, MD. Agency for Healthcare Policy and Research, 1997. http://meps.ahrq.gov/mepsweb/data_files/publications/mr1/mr1.pdf
Chowdhury, S.R., Machlin, S.R., Gwet, K.L. Sample Designs of the Medical Expenditure Panel Survey Household Component, 1996–2006 and 2007–2016. Methodology Report #33. January 2019. Agency for Healthcare Research and Quality, Rockville, MD. https://meps.ahrq.gov/data_files/publications/mr33/mr33.pdf
Machlin, S.R., Chowdhury, S.R., Ezzati-Rice, T., DiGaetano, R., Goksel, H., Wun, L.-M., Yu, W., Kashihara, D. Estimation Procedures for the Medical Expenditure Panel Survey Household Component. Methodology Report #24. September 2010. Agency for Healthcare Research and Quality, Rockville, MD. https://meps.ahrq.gov/data_files/publications/mr24/mr24.shtml
Mitchell, E., Ahrnsbrak, R., Soni, A., and Machlin, S. Analyzing Medical Conditions in MEPS: User Guide (Part 1 of 2). Methodology Report #36. Rockville, MD: Agency for Healthcare Research and Quality; February 2023. https://meps.ahrq.gov/data_files/publications/mr36/mr36ug.shtml
Mitchell, E., Ahrnsbrak, R., Soni, A., and Machlin, S. Analyzing Medical Conditions in MEPS: Detailed Reference Guide (Part 2 of 2). Methodology Report #36. Rockville, MD: Agency for Healthcare Research and Quality; February 2023. https://meps.ahrq.gov/data_files/publications/mr36/mr36dr.shtml
Stagnitti, M.N., Machlin, S.R., Zodet, M.W., Saleska, E. Design, Methods, and Field Results of the Medical Expenditure Panel Survey Medical Provider Component (MEPS MPC) including the Medical Organizations Survey (MOS) — 2016 Data Year. Methodology Report #32. October 2018. Agency for Healthcare Research and Quality, Rockville, MD. https://meps.ahrq.gov/data_files/publications/mr32/mr32.pdf
Notes
1 American Psychiatric Association. Diagnostic and Statistical Manual of Mental Disorders. 5th Edition, Text Revision. Washington, DC : American Psychiatric Association, 2022.
2 Grosvenor LP, Croen LA, Lynch FL, Marafino B, Maye M, Penfold RB, Simon G, and Ames JL. Autism diagnosis among US children and adults, 2011-2022. JAMA Netw Open. 2024;7(10):e2442218. doi:10.1001/jamanetworkopen.2024.42218
3 This statistical brief focuses on the treated prevalence not population prevalence of ASD.
4 Xu G, Stranthearn L, Liu B, O'Brien M, Kopelman TG, Zhu J, Snetselaar LG, and Bao W. Prevalence and treatment patterns of Autism Spectrum Disorder in the United States, 2016. JAMA Pediatrics. 2019;173(2):153-159. doi:10.1001/jamapediatrics.2018.4208
5 Dollars were inflated to 2022 levels using the CMS Office of the Actuary Personal Health Care Index price index (see https://meps.ahrq.gov/about_meps/Price_Index.shtml for more details).
Suggested Citation
Monnet, J. and Zuvekas, S.H. Treated Prevalence and Health Expenditures among Children with Autism Spectrum Disorder, U.S. Civilian Noninstitutionalized Population, 2018-2022. Statistical Brief #565. AHRQ Publication No. 25-0062. August 2025. Agency for Healthcare Research and Quality, Rockville, MD. https://meps.ahrq.gov/data_files/publications/st565/stat565.shtml
AHRQ welcomes questions and comments from readers of this publication who are interested in obtaining more information about access, cost, use, financing, and quality of healthcare in the United States. We also invite you to tell us how you are using this Statistical Brief and other MEPS data and tools and to share suggestions on how MEPS products might be enhanced to further meet your needs. Please email us at MEPSProjectDirector@ahrq.hhs.govor send a letter to the address below:
Samuel H. Zuvekas, PhD, Acting Director
Center for Financing, Access and Cost Trends
Agency for
Healthcare Research and Quality
5600 Fishers Lane, Mailstop 07W41A
Rockville, MD 20857
Tables and Figures
Table 1. Average Annual Percent of Children Treated for Autism Spectrum Disorder, 2018-2022
| All Children (N) | Weighted Population in Millions (95% CI) | Children Treated for ASD (N) | Weighted Population in Millions (95% CI) | Weighted % Treated for ASD (95% CI) | |
|---|---|---|---|---|---|
| Total | 25,181 | 310 (284 - 335) |
329 | 3.9 (3.2 - 4.5) |
1.2% (1.0 - 1.5) |
| Sex | |||||
| Male | 13,037 | 158 (145 - 171) |
258 | 2.9 (2.4 - 3.5) |
1.9% (1.5 - 2.2) |
| Female | 12,144 | 152 (138 - 165) |
71 | 0.9 (0.6 - 1.3) |
0.6%a (0.4 - 0.8) |
| Age | |||||
| 3-7 years | 8,028 | 100 (92 - 109) |
121 | 1.4 (1.0 - 1.8) |
1.4% (1.0 - 1.8) |
| 8-12 years | 8,402 | 102 (93 - 110) |
109 | 1.2 (0.9 - 1.6) |
1.2% (0.9 - 1.5) |
| 13-17 years | 8,751 | 108 (99 - 117) |
99 | 1.2 (0.9 - 1.6) |
1.1% (0.8 - 1.5) |
| Insurance | |||||
| Any Private | 12,780 | 187 (169 - 204) |
152 | 2.1 (1.6 - 2.6) |
1.1% (0.9 - 1.4) |
| Public Only | 11,682 | 115 (104 - 126) |
173 | 1.7 (1.3 - 2.1) |
1.5% (1.1 - 1.8) |
| Uninsured | 719 | 8 (6 - 10) |
-- | -- -- |
-- -- |
| Poverty | |||||
| < 200% FPL | 11,906 | 111 (101 - 122) |
172 | 1.6 (1.2 - 2.0) |
1.5% (1.1 - 1.8) |
| ≥ 200% FPL | 13,275 | 198 (180 - 216) |
157 | 2.2 (1.7 - 2.8) |
1.1% (0.9 - 1.4) |
Source: Agency for Healthcare Research and Quality, Medical Expenditure Panel Survey, Household Component, 2018-2022.
Notes: N represents the unweighted sample size. 95% confidence intervals (CI) are reported in parentheses. Statistics are not reported for uninsured children with treated autism spectrum disorder (ASD) due to insufficient sample size (i.e., the unweighted sample size is < 60).
a Indicates a statistically significant difference at the 5% level or higher.
Table 2. Average Health Expenditures for Children with and without Treated ASD, 2018-2022
| Children w/out ASD (95% CI) |
Children w/ ASD (95% CI) |
|
|---|---|---|
| Total Expenditures | $2,201 ($2,027 - $2,376) |
$20,122a ($13,098 - $27,147) |
| ASD-Specific Expenditures | -- -- |
$14,048 ($7,375 - $20,722) |
| Expenditures Ratio | -- -- |
69.8% (58.2 - 81.4) |
Source: Agency for Healthcare Research and Quality, Medical Expenditure Panel Survey, Household Component, 2018-2022.
Notes: 95% confidence intervals (CI) are reported in parentheses.
a Indicates a statistically significant difference in total expenditures at the 5% level or higher.
Table 3. Average Health Expenditures for Children with and without Treated ASD by Service Category, 2018-2022
| Children w/out Treated ASD (95% CI) |
Children w/ Treated ASD (95% CI) |
|
|---|---|---|
| Ambulatory | $1,101 ($961 - $1,241) |
$10,279a ($7,588 - $12,969) |
| Home Health | $102 ($71 - $134) |
$7,168a † ($812 - $13,524) |
| Inpatient | $214 ($172 - $256) |
$760a † ($246 - $1,275) |
| Rx | $253 ($223 - $283) |
$1,384a ($943 - $1,826) |
| Other | $531 ($494 - $568) |
$531 ($379 - $682) |
Source: Agency for Healthcare Research and Quality, Medical Expenditure Panel Survey, Household Component, 2018-2022.
Notes: 95% confidence intervals (CI) are reported in parentheses.
a Indicates a statistically significant difference in expenditures between children with and without treated ASD at the 5% level or higher.
† Indicates questionable precision (i.e., 0.30 ≤ RSE ≤ 0.50).
Figure 1. Average Total Health Expenditures for Children with and without Treated ASD by Service Category, 2018-2022
Source: Agency for Healthcare Research and Quality, Medical Expenditure Panel Survey, Household Component, 2018-2022.
Table 4. Average Total Health Expenditures for Children with and without Treated ASD by Sex, 2018-2022
| Children w/out Treated ASD (95% CI) |
Children w/ Treated ASD (95% CI) |
|
|---|---|---|
| Male | $2,328 ($2,057 - $2,599) |
$18,556a ($10,343 - $26,769) |
| Female | $2,071b ($1,905 - $2,237) |
$25,142a ($12,837 - $37,448) |
Source: Agency for Healthcare Research and Quality, Medical Expenditure Panel Survey, Household Component, 2018-2022.
Notes: 95% confidence intervals (CI) are reported in parentheses.
a Indicates a statistically significant difference in expenditures between children with and without treated ASD at the 5% level or higher.
b Indicates a statistically significant difference in expenditures between male and female children at the 10% level.
Figure 2. Average Total Health Expenditures for Children with and without Treated ASD by Sex, 2018-2022
Source: Agency for Healthcare Research and Quality, Medical Expenditure Panel Survey, Household Component, 2018-2022.
Table 5. Average Total Health Expenditures for Children with and without Treated ASD by Age, 2018-2022
| Children w/out Treated ASD (95% CI) |
Children w/ Treated ASD (95% CI) |
|
|---|---|---|
| 3-7 years | $1,691 ($1,534 - $1,847) |
$24,426a ($16,407 - $32,445) |
| 8-12 years | $2,163b ($1,784 - $2,542) |
$21,698a † ($2,760 - $40,635) |
| 13-17 years | $2,710b ($2,473 - $2,948) |
$13,639a b ($9,184 - $18,093) |
Source: Agency for Healthcare Research and Quality, Medical Expenditure Panel Survey, Household Component, 2018-2022.
Notes: 95% confidence intervals (CI) are reported in parentheses.
a Indicates a statistically significant difference in expenditures between children with and without treated ASD at the 5% level or higher.
b Indicates a statistically significant difference in expenditures between age categories at the 5% level or higher (reference group is 3-7 years).
† Indicates questionable precision (i.e., 0.30 ≤ RSE ≤ 0.50).
Figure 3. Average Total Health Expenditures for Children with and without Treated ASD by Age, 2018-2022
Source: Agency for Healthcare Research and Quality, Medical Expenditure Panel Survey, Household Component, 2018-2022.
Table 6. Average Total Health Expenditures for Children with and without Treated ASD by Insurance, 2018-2022
| Children w/out Treated ASD (95% CI) |
Children w/ Treated ASD (95% CI) |
|
|---|---|---|
| Any Private | $2,579 ($2,327 - $2,832) |
$23,858a ($11,961 - $35,755) |
| Public Only | $1,662b ($1,486 - $1,839) |
$15,544a ($10,456 - $20,631) |
| Uninsured | -- -- |
-- -- |
Source: Agency for Healthcare Research and Quality, Medical Expenditure Panel Survey, Household Component, 2018-2022.
Notes: Statistics are not reported for uninsured children due to insufficient sample size (i.e., the unweighted sample size is < 60) for children with treated ASD. 95% confidence intervals (CI) are reported in parentheses.
a Indicates a statistically significant difference in expenditures between children with and without treated ASD at the 5% level or higher.
b Indicates a statistically significant difference in expenditures between insurance coverage categories at the 5% level or higher.
Figure 4. Average Total Health Expenditures for Children with and without Treated ASD by Insurance Coverage, 2018-2022
Source: Agency for Healthcare Research and Quality, Medical Expenditure Panel Survey, Household Component, 2018-2022.
Table 7. Average Total Health Expenditures for Children with and without Treated ASD by Poverty Level, 2018-2022
| Children w/out Treated ASD (95% CI) |
Children w/ Treated ASD (95% CI) |
|
|---|---|---|
| < 200% FPL | $1,736 ($1,548 - $1,925) | $14,192a ($9,789 - $18,596) |
| ≥ 200% FPL | $2,462b ($2,217 - $2,706) | $24,446a b ($13,031 - $35,860) |
Source: Agency for Healthcare Research and Quality, Medical Expenditure Panel Survey, Household Component, 2018-2022.
Notes: 95% confidence intervals (CI) are reported in parentheses.
a Indicates a statistically significant difference in expenditures between children with and without treated ASD at the 5% level or higher.
b Indicates a statistically significant difference in expenditures between poverty categories at the 10% level or higher.
Figure 5. Average Total Health Expenditures for Children with and without Treated ASD by Poverty Level, 2018-2022
Source: Agency for Healthcare Research and Quality, Medical Expenditure Panel Survey, Household Component, 2018-2022.
AHRQ Pub. No. 25-0062
August 2025