
|
|
|
Font Size:
|
||||
|
|
|
|
||||
Benzodiazepine Use Among Older Adults: Any Use and Concurrent Use With Opioids
Statistical Brief #567 | October 2025 | Salam Abdus, PhD and G. Edward Miller, PhD
Highlights
- In 2021-2022, 4.0 percent of adults aged 65 or older used benzodiazepines only (no opioids), and 1.5 percent of adults aged 65 or older used both benzodiazepines and opioids.
- In 2021-2022, older adults with Medicare Part D coverage were more likely to use both benzodiazepines and opioids (1.6%) than older adults with other drug coverage (1.0%).
- In 2021-2022, older adults in the Northeast Census region were more likely to use benzodiazepines only (5.8%) than older adults living in the Midwest (3.6%), South (4.1%), or West (2.9%) Census regions.
- In 2021-2022, older adults whose perceived health was fair or poor were more likely (5.1%) to use benzodiazepines only than those who reported better perceived health (3.8%). Those with perceived fair or poor health were also more likely (3.7%) to use both benzodiazepines and opioids than those reporting better perceived health (0.9%).
Introduction
Potentially inappropriate medication use may pose health risks among older adults. The 2023 American Geriatrics Society (AGS) Beers Criteria for potentially inappropriate medication use among the elderly, as well as the earlier versions of this criteria, recommends avoiding use of benzodiazepines among adults aged 65 or over.1,2 Also, concurrent use of benzodiazepines and opioids may pose a significant health hazard for the elderly. The 2023 AGS Beers Criteria recommends avoiding concurrent use of benzodiazepines and opioids for adults aged 65 or over with or at high risk of delirium, or with a history of falls and fractures.1
Using data from the 2021-2022 Medical Expenditure Panel Survey Household Component (MEPS-HC), this Statistical Brief examines utilization of benzodiazepines and concurrent utilization of benzodiazepines and opioids among older adults. The sample includes all individuals aged 65 and older. We examine average annual percentages of adults aged 65 and older in 2021-2022 with (1) any benzodiazepine utilization only (with no opioid utilization in the same year) and (2) concurrent benzodiazepine and opioid utilization (utilization of both benzodiazepines and opioids in the same year). We present estimates for the full population of adults aged 65 and older and for subgroups defined by sex, age, poverty status, prescription drug coverage, Census region, Metropolitan Statistical Area (MSA) status, perceived health status, and presence of chronic conditions. All differences discussed in the text are statistically significant at the 0.05 level.
Findings
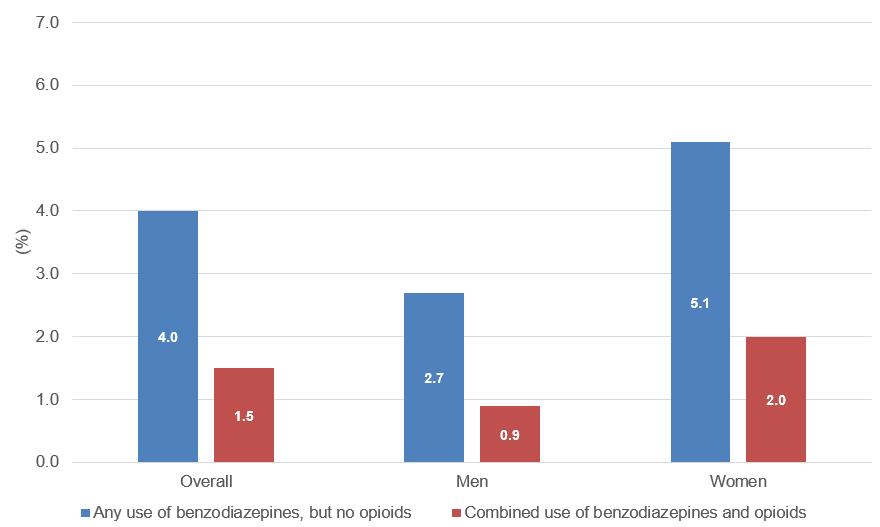
Overall and sex (Figure 1)
In 2021-2022, 4.0 percent of older adults used benzodiazepines only, and 1.5 percent of older adults used both benzodiazepines and opioids. Utilization of benzodiazepines only was higher among older women (5.1%) compared to older men (2.7%). Similarly, concurrent utilization of benzodiazepines and opioids was higher among older women (2.0%) compared to older men (0.9%).
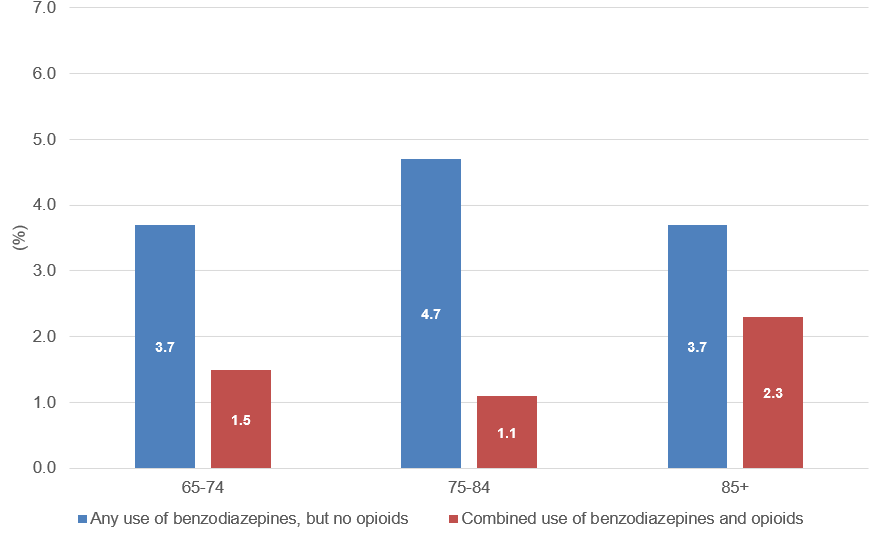
Age (Figure 2)
There were no statistically significant differences in utilization of benzodiazepines only or concurrent benzodiazepine-opioid utilization across subgroups of older adults defined by age. In 2021-2022, among adults aged between 65 and 74, between 75 and 84, and 85 or over, the average annual percentages with benzodiazepine use only were 3.7 percent, 4.7 percent, and 3.7 percent, respectively. The average annual percentages of adults who used both benzodiazepines and opioids among adults aged between 65 and 74, between 75 and 84, and 85 or over were 1.5 percent, 1.1 percent, and 2.3 percent, respectively.
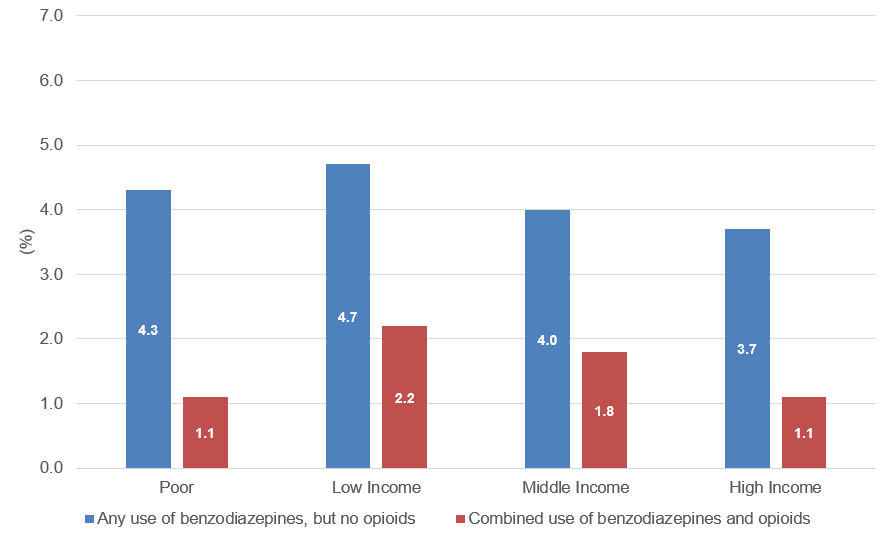
Poverty status (Figure 3)
In 2021-2022, there were no significant differences across income groups in utilization of benzodiazepines only. Among poor, low income, middle income, and high-income older adults, the average annual percentages with benzodiazepine utilization only were 4.3 percent, 4.7 percent, 4.0 percent, and 3.7 percent, respectively. The proportion of low-income older adults who used both benzodiazepines and opioids (2.2%) was higher than that among poor older adults (1.1%), or that among high income older adults (1.1%), but was not statistically significantly different from that among middle income older adults (1.8%).
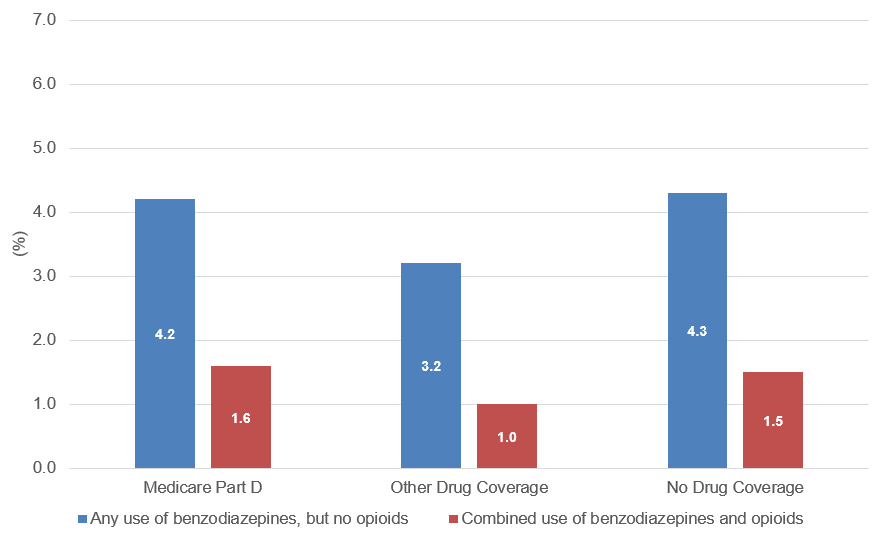
Prescription drug coverage (Figure 4)
In 2021-2022, average annual percentages of older adults who used benzodiazepines only did not differ statistically significantly by prescription drug coverage type. Among older adults who had Medicare Part D coverage, other drug coverage, and no drug coverage, the average annual percentages with benzodiazepine use only were 4.2 percent, 3.2 percent, and 4.3 percent, respectively. The average annual percentage of older adults with Medicare Part D coverage who used both benzodiazepines and opioids (1.6%) was higher than that among older adults with other drug coverage (1.0%), but was not statistically significantly different from that among older adults with no drug coverage (1.5%).
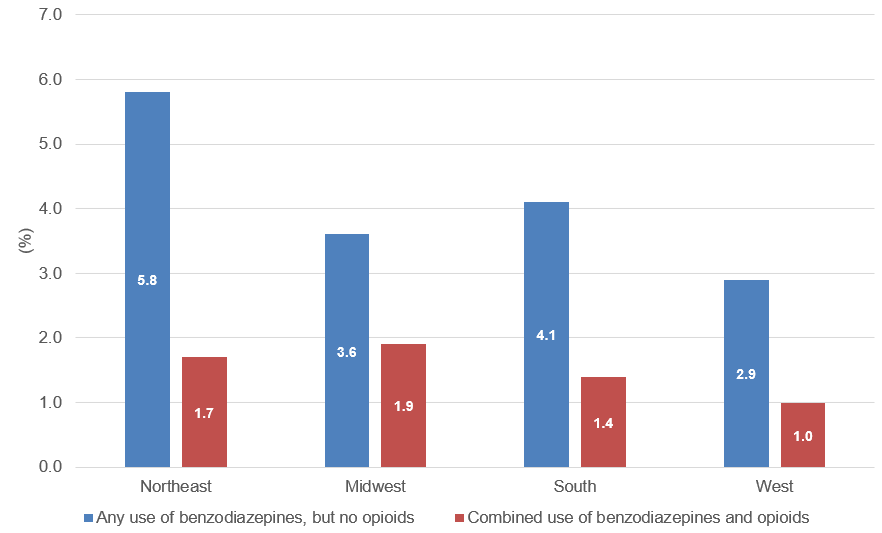
Census region (Figure 5)
In 2021-2022, older adults who lived in the Northeast Census region were more likely to use benzodiazepines only (5.8%) than older adults who lived in the Midwest (3.6%), South (4.1%), or West (2.9%) Census regions. However, utilization of both benzodiazepines and opioids among older adults who lived in the Northeast Census region (1.7%) was not statistically significantly different from that among older adults who lived in the Midwest (1.9%), South (1.4%), or West (1.0%) Census regions.
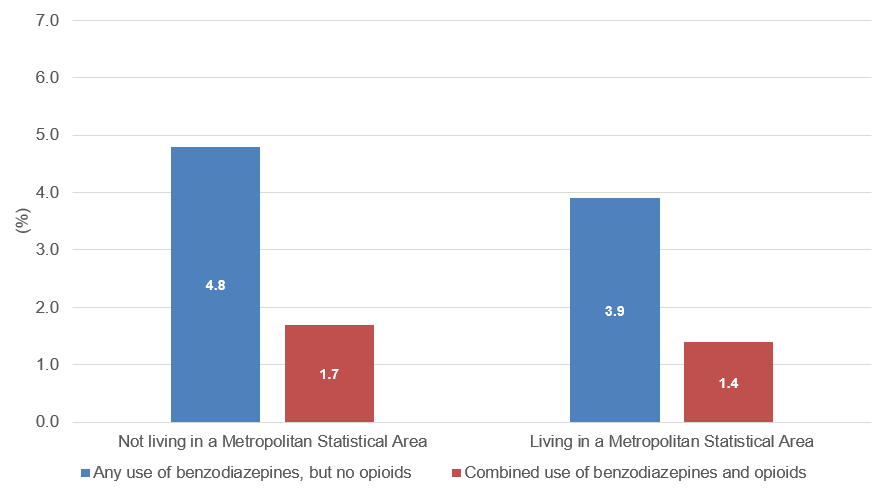
MSA status (Figure 6)
Utilization of benzodiazepines only or concurrent utilization of benzodiazepines and opioids did not differ significantly by MSA status. In 2021-2022, among older adults who lived in MSAs and non-MSAs, the average annual percentages of older adults who used benzodiazepines only were 3.9 percent and 4.8 percent, respectively, and the average annual percentages of older adults who used both benzodiazepines and opioids were 1.4 percent and 1.7 percent, respectively.
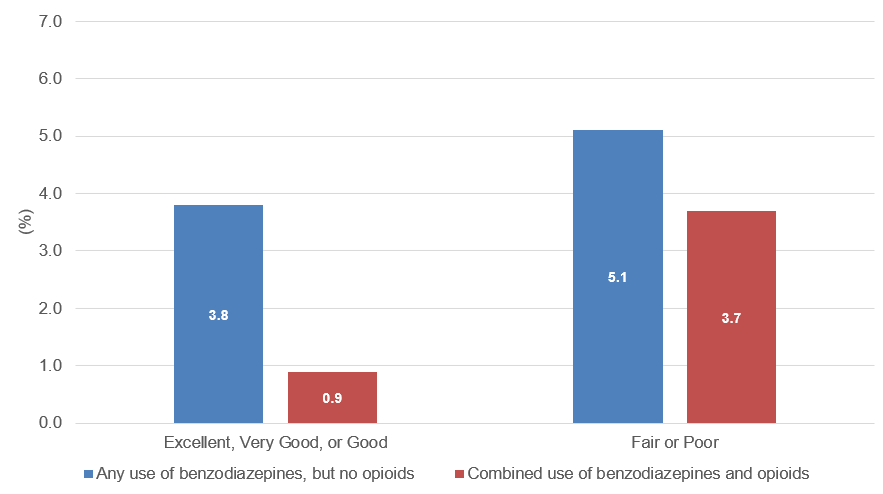
Perceived health status (Figure 7)
Both utilization of benzodiazepines only and concurrent utilization of benzodiazepines and opioids were higher for those with worse perceived health. In 2021-2022, older adults whose perceived health was fair or poor were more likely (5.1%) to use benzodiazepines only than those who reported better perceived health (3.8%). Those whose perceived health was fair or poor were also more likely (3.7%) to use both benzodiazepines and opioids than those reporting better perceived health (0.9%).
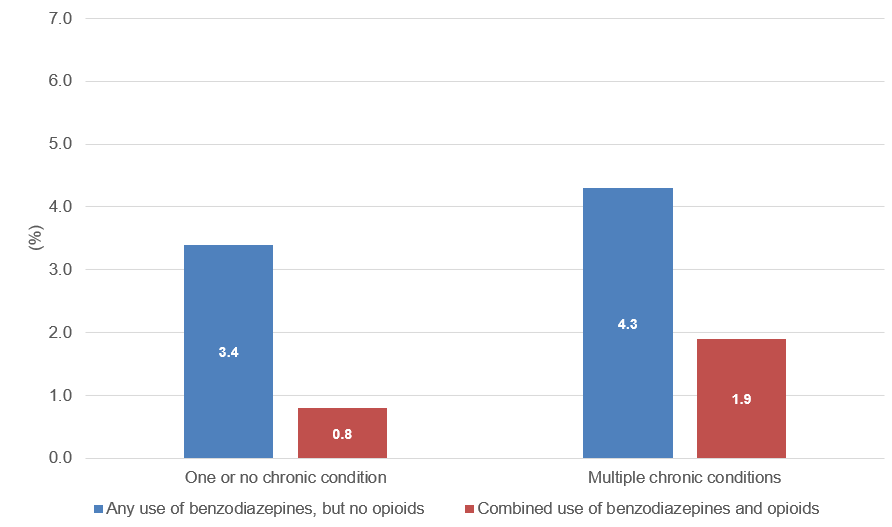
Chronic conditions (Figure 8)
In 2021-2022, older adults who had two or more chronic conditions were more likely (4.3%) to use benzodiazepines only than those who had no or only one chronic condition (3.4%). Those with multiple chronic conditions were also more likely (1.9%) to use both benzodiazepines and opioids than those who had no or only one chronic condition (0.9%).
Data Source
The estimates presented in this Statistical Brief were derived from the MEPS Full Year Consolidated Data Files (HC-233, HC-243), and the confidential version of the MEPS Prescribed Medicine files (HC-229A, HC-239A) for the years 2021 and 2022.
Definitions
Benzodiazepines
We used the Multum Lexicon Plus database of Oracle Health, linked to the MEPS PMED files, to identify outpatient prescription fills of benzodiazepines. In Multum, some drugs have multiple sub-subclasses. We classified drugs as benzodiazepines if any of the therapeutic sub-subclasses of the drug was benzodiazepines.
Opioids
We examined outpatient prescription fills of opioids that were commonly used to treat pain. These opioids were identified by generic drug names for narcotic analgesics and narcotic analgesic combinations in the Multum Lexicon database from Cerner Multum, Inc. We identified slightly more of the opioids that were commonly used for pain than one would find in the MEPS public use files due to the methods used to preserve the confidentiality of sample members. Opioids that were excluded from our analysis include respiratory agents, antitussives, and drugs commonly used in medication-assisted treatment.
Adults aged 65 and older (older adults)
The age variable used to identify adults aged 65 and older was based on the sample person's age at the end of the year. If data were not collected during a round because the sample person was out of scope (e.g., deceased or institutionalized), then the age at the time of the previous round was used.
Poverty status
Each sample person was classified according to the total annual income of their family. Possible sources of income included annual earnings from wages, salaries, bonuses, tips, and commissions; business and farm gains and losses; unemployment and Worker's Compensation; interest and dividends; alimony, child support, and other private cash transfers; private pensions, individual retirement account withdrawals, Social Security benefits, and Department of Veterans Affairs payments; Supplemental Security Income and cash welfare payments from public assistance, and Aid to Families with Dependent Children; gains or losses from estates, trusts, partnerships, S corporations, rent, and royalties; and a small amount of "other" income. Poverty status is the ratio of family income to the corresponding federal poverty thresholds, which control for family size and the age of the head of the family. Categories are defined as follows:
- Poor: Household income below the federal poverty line
- Low income: Household income greater than or equal to the poverty line and less than 200 percent of the poverty line
- Middle income: Household income 200 percent to less than 400 percent of the poverty line
- High income: Household income greater than or equal to 400 percent of the poverty line
Prescription drug coverage
Persons were classified into three mutually exclusive prescription drug coverage categories as follows:
- Medicare Part D coverage: If the person had drug coverage by the Medicare prescription drug benefit (Part D) in any round during the year.
- Other drug coverage: The person did not have Medicare Part D coverage, but had 1) TRICARE coverage at any time, or 2) coverage through the VA at any time, or 3) coverage through a private health insurance plan that included at least some prescription drug coverage, in any round during the year.
- No drug coverage: The person had no drug coverage during the year.
Census region
The Census region variable was based on the geographic location of the household at the end of the year. If missing, the most recent geographic location available was used. Regions are composed of groups of states as listed below:
- Northeast: Connecticut, Maine, Massachusetts, New Hampshire, New Jersey, New York, Pennsylvania, Rhode Island, and Vermont
- Midwest: Illinois, Indiana, Iowa, Kansas, Michigan, Minnesota, Missouri, Nebraska, North Dakota, Ohio, South Dakota, and Wisconsin
- South: Alabama, Arkansas, Delaware, District of Columbia, Florida, Georgia, Kentucky, Louisiana, Maryland, Mississippi, North Carolina, Oklahoma, South Carolina, Tennessee, Texas, Virginia, and West Virginia
- West: Alaska, Arizona, California, Colorado, Hawaii, Idaho, Montana, Nevada, New Mexico, Oregon, Utah, Washington, and Wyoming
Metropolitan Statistical Area (MSA)
The MSA variable was based on the geographic location of the household at the end of the year and reflects the most recent delineations of MSAs established by the Office of Management and Budget (OMB). An MSA contains a core urban area with a population of 50,000 or more. All counties that are not part of an MSA are considered rural areas.
Perceived health status
The MEPS respondent was asked to rate the health of each person in the family at the time of the interview according to the following categories: excellent, very good, good, fair, and poor. Information from the last round of interview of the calenda year was used. For persons with missing health status in the last round of interview of the year, the response for health status at the previous rounds were used, if available. A small percentage of persons (<1%) had a missing response for perceived health status.
Chronic conditions
Using the household-reported priority conditions in MEPS-HC, the following diagnosed conditions were identified: diabetes, asthma, hypertension, arthritis, heart disease, cancer, chronic bronchitis, stroke, and emphysema. Individuals who were reported to have ever been diagnosed with coronary heart disease, angina, myocardial infarction, or any other kind of heart condition or heart disease were defined as having heart disease. Individuals who were reported to have ever been diagnosed with asthma and who were reported to still had asthma or had an asthma attack in the past 12 months were defined as having asthma. Individuals who were reported to have been diagnosed with high blood pressure on two or more occasions were defined as having hypertension.
About MEPS-HC
The Medical Expenditure Panel Survey Household Component (MEPS-HC) collects nationally representative data on health care use, expenditures, sources of payment, and insurance coverage for the U.S. civilian noninstitutionalized population. The MEPS-HC is cosponsored by the Agency for Healthcare Research and Quality (AHRQ) and the National Center for Health Statistics (NCHS). More information about the MEPS-HC can be found on the MEPS Web site at https://meps.ahrq.gov/.
References
For a detailed description of the MEPS-HC survey design, sample design, and methods used to minimize sources of nonsampling error, see the following publications:
Cohen J. Design and Methods of the Medical Expenditure Panel Survey Household Component. MEPS Methodology Report No. 1. Agency for Health Care Policy Research Pub. No. 97-0026. Rockville, MD: Agency for Health Care Policy and Research; 1997. https://meps.ahrq.gov/data_files/publications/mr1/mr1.pdf.
Cohen S. Sample Design of the 1996 Medical Expenditure Panel Survey Household Component. MEPS Methodology Report No. 2. Agency for Health Care Policy and Research Pub. No. 97-0027. Rockville, MD: Agency for Healthcare Research and Quality, 1997. https://meps.ahrq.gov/data_files/publications/mr2/mr2.pdf
Suggested Citation
Abdus, S. and Miller, G.E. Benzodiazepine Use Among Older Adults: Any Use and Concurrent Use with Opioids. Statistical Brief #567. AHRQ Publication No. 25-0094. October 2025. Agency for Healthcare Research and Quality, Rockville, MD. https://meps.ahrq.gov/data_files/publications/st567/stat567.shtml
Notes
1 By the 2023 American Geriatrics Society Beers Criteria® Update Expert Panel. American Geriatrics Society 2023 updated AGS Beers Criteria® for potentially inappropriate medication use in older adults. J Am Geriatr Soc. 2023;71(7):2052-2081. doi:10.1111/jgs.18372.
2 American Geriatrics Society updated Beers Criteria for potentially inappropriate medication use in older adults. J Am Geriatr Soc. 2012; 60:616-631.
AHRQ welcomes questions and comments from readers of this publication who are interested in obtaining more information about access, cost, use, financing, and quality of healthcare in the United States. We also invite you to tell us how you are using this Statistical Brief and other MEPS data and tools and to share suggestions on how MEPS products might be enhanced to further meet your needs. Please email us at MEPSProjectDirector@ahrq.hhs.govor send a letter to the address below:
Samuel H. Zuvekas, PhD, Acting Director
Center for Financing, Access and Cost Trends
Agency for Healthcare Research and Quality
5600 Fishers Lane, Mailstop 07W41A
Rockville, MD 20857
Figures
Figure 1. Proportions of adults aged 65 or over with any benzodiazepine use and concurrent benzodiazepine-opioid use, overall and by sex, 2021-2022
| Any use of benzodiazepines, but no opioids (%) | Combined use of benzodiazepines and opioids (%) | |
|---|---|---|
| Overall | 4.0 | 1.5 |
| Men | 2.7 | 1.9 |
| Women | 5.1 | 2.0 |
Source: Agency for Healthcare Research and Quality, Medical Expenditure Panel Survey, Household Component, 2021-22.
Figure 2. Proportions of adults aged 65 or over with any benzodiazepine use and concurrent benzodiazepine-opioid use, by age, 2021-2022
| Any use of benzodiazepines, but no opioids (%) | Combined use of benzodiazepines and opioids (%) | |
|---|---|---|
| 65-74 | 3.7 | 1.5 |
| 75-84 | 4.7 | 1.1 |
| 85+ | 3.7 | 2.3 |
Source: Agency for Healthcare Research and Quality, Medical Expenditure Panel Survey, Household Component, 2021-22.
Figure 3. Proportions of adults aged 65 or over with any benzodiazepine use and concurrent benzodiazepine-opioid use, by poverty status, 2021-2022
| Any use of benzodiazepines, but no opioids (%) | Combined use of benzodiazepines and opioids (%) | |
|---|---|---|
| Poor | 4.3 | 1.1 |
| Low Income | 4.7 | 2.2 |
| Middle Income | 4.0 | 1.8 |
| High Income | 3.7 | 1.1 |
Source: Agency for Healthcare Research and Quality, Medical Expenditure Panel Survey, Household Component, 2021-22.
Figure 4. Proportions of adults aged 65 or over with any benzodiazepine use and concurrent benzodiazepine-opioid use, by insurance status, 2021-2022
| Any use of benzodiazepines, but no opioids (%) | Combined use of benzodiazepines and opioids (%) | |
|---|---|---|
| Medicare Part D | 4.2 | 1.6 |
| Other Drug Coverage | 3.2 | 1.0 |
| No Drug Coverage | 4.3 | 1.5 |
Source: Agency for Healthcare Research and Quality, Medical Expenditure Panel Survey, Household Component, 2021-22.
Figure 5. Proportions of adults aged 65 or over with any benzodiazepine use and concurrent benzodiazepine-opioid use, by Census region, 2021-2022
| Any use of benzodiazepines, but no opioids (%) | Combined use of benzodiazepines and opioids (%) | |
|---|---|---|
| Northeast | 5.8 | 1.7 |
| Midwest | 3.6 | 1.9 |
| South | 4.1 | 1.4 |
| West | 2.9 | 1.0 |
Source: Agency for Healthcare Research and Quality, Medical Expenditure Panel Survey, Household Component, 2021-22.
Figure 6. Proportions of adults aged 65 or over with any benzodiazepine use and concurrent benzodiazepine-opioid use, by urbanicity, 2021-2022
| Any use of benzodiazepines, but no opioids (%) | Combined use of benzodiazepines and opioids (%) | |
|---|---|---|
| Not living in a Metropolitan Statistical Area | 4.8 | 1.7 |
| Living in a Metropolitan Statistical Area | 3.9 | 1.4 |
Source: Agency for Healthcare Research and Quality, Medical Expenditure Panel Survey, Household Component, 2021-22.
Figure 7. Proportions of adults aged 65 or over with any benzodiazepine use and concurrent benzodiazepine- opioid use, by self-reported health status, 2021-2022
| Any use of benzodiazepines, but no opioids (%) | Combined use of benzodiazepines and opioids (%) | |
|---|---|---|
| Excellent, Very Good, or Good | 3.8 | 0.9 |
| Fair or Poor | 5.1 | 3.7 |
Source: Agency for Healthcare Research and Quality, Medical Expenditure Panel Survey, Household Component, 2021-22.
Figure 8. Proportions of adults aged 65 or over with any benzodiazepine use and concurrent benzodiazepine-opioid use, by presence of chronic conditions, 2021-2022
| Any use of benzodiazepines, but no opioids (%) | Combined use of benzodiazepines and opioids (%) | |
|---|---|---|
| One or no chronic condition | 3.4 | 0.8 |
| Multiple chronic conditions | 4.3 | 1.9 |
Source: Agency for Healthcare Research and Quality, Medical Expenditure Panel Survey, Household Component, 2021-22.
AHRQ Pub. No. 25-0094
October 2025