
|
|
|
Font Size:
|
||||
|
|
|
|
||||
Healthcare Expenditures for Diabetes Among Adults Aged 18 and Older in the U.S. Civilian Noninstitutionalized Population, 2021-2022
Statistical Brief #568 | December 2025 | Terceira A. Berdahl, PhD & Asako S. Moriya, PhD
Highlights
- In 2021-2022, on average, 10.2 percent of adults (26.3 million individuals) aged 18 and older per year were treated for diabetes. Adults living in families with income below 125 percent of the Federal Poverty Level (FPL) had the highest rate of treated diabetes (14.9%), while those living in high-income families (above 400% FPL) had the lowest rate of treated diabetes (7.9%).
- Among age groups, the treated diabetes rate was highest for those aged 65 and older (21.6%) compared to adults aged 45-64 (12.7%). Men were more likely than women to have treated diabetes (10.7% vs. 9.6%).
- Healthcare expenditures for diabetes treatment for adults in the U.S. totaled $153.2 billion annually in 2021-2022, with an average annual cost of $5,810 per adult with treated diabetes.
- The majority of diabetes expenditures (80.3%) were incurred through prescription medications.
- The average annual cost of inpatient hospital stays for diabetes was $15,380 among persons hospitalized for diabetes.
- Nearly three-quarters of diabetes treatment costs were paid by Medicare (41.0%) or private insurance (32.0%).
Introduction
Diabetes is a common chronic condition that can lead to serious health complications, including multiple types of heart disease, kidney disease, foot problems, and eye problems (Borén et al., 2024; Deshpande et al., 2008). About 1 in 10 adults in the United States have been diagnosed with diabetes, while many more have prediabetes (1 in 3 adults) (Gwira et al., 2024; CDC 2022).
This Statistical Brief uses data from the 2021-2022 Medical Expenditure Panel Survey-Household Component (MEPS-HC) to estimate diabetes-related health service utilization and expenditures for adults treated for diabetes in the U.S. civilian noninstitutionalized population. Consequently, our estimates do not include expenditures for diabetes care received by residents of nursing homes and should not be interpreted to include costs of care in those settings. For the non-institutionalized U.S. general population, service utilization rates for any type of treatment for diabetes by demographic characteristics are presented.
This Brief also provides estimates of expenditures for diabetes by type of service and source of payment among adults with treated diabetes. The estimates in this Brief do not include indirect costs of diabetes (such as lost productivity) or care for diabetes complications (which can result in high-cost medical events, such as ER visits and inpatient hospital stays), and therefore the estimates in this Brief are not directly comparable to other estimates that include these types of expenditures (Parker et al., 2022). All estimates are weighted to account for nonresponse and the MEPS-HC's complex survey design. Differences reported in the text are statistically significant at the 5 percent level or higher.
Findings
Adults who received any diabetes treatment by demographic and socioeconomic characteristics and region (figures 1 and 2)
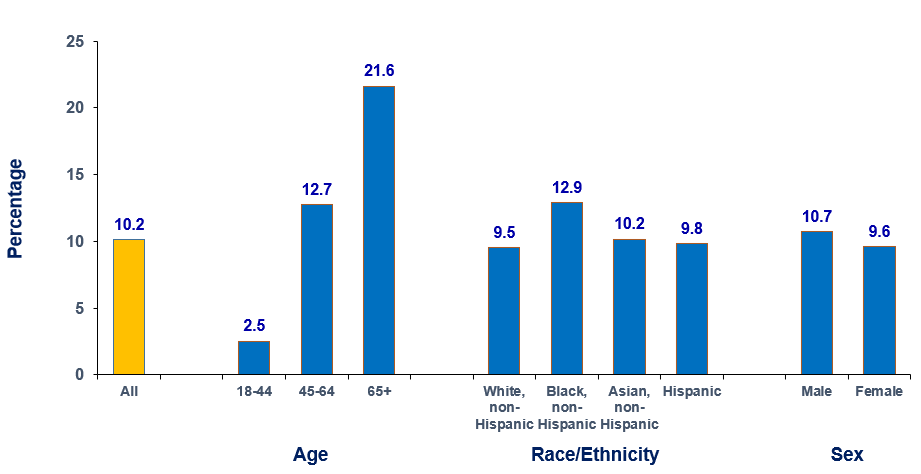
In 2021-2022, an estimated 10.2 percent of adults aged 18 years and older in the U.S. civilian noninstitutionalized population (about 26 million adults) received any diabetes treatment per year (figure 1). This percentage was highest for those aged 65 and older (21.6%, or an estimated 12.9 million individuals), followed by adults aged 45-64 (12.7%, or an estimated 10.5 million individuals) and those aged 18-44 (2.5%, or an estimated 3.0 million individuals). Average annual diabetes treatment rates were higher for Black non-Hispanic adults (12.9%) than for any other racial-ethnic group, including: White non-Hispanic adults (9.5%), Asian non-Hispanic adults (10.2%), and Hispanic adults (9.8%). Men were more likely than women to receive any diabetes treatment (10.7% vs. 9.6%).
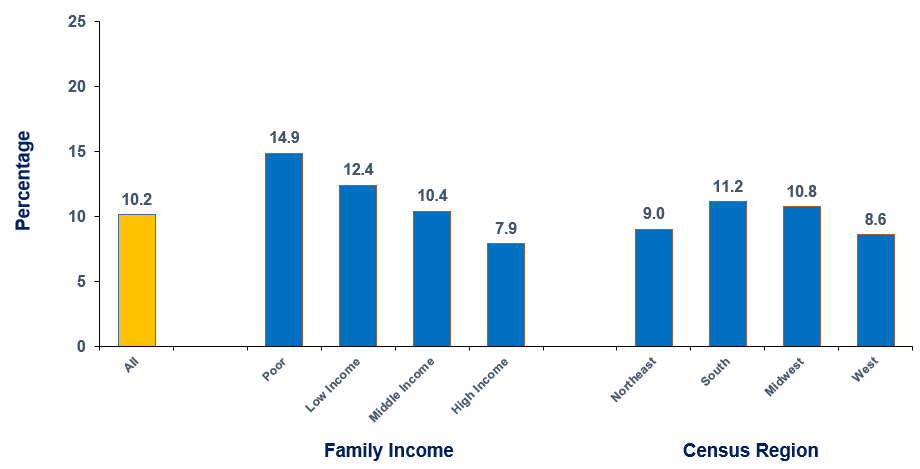
The highest frequency of having diabetes treatment occurred among adults in families with incomes less than 125 percent of FPL (14.9%), followed by 12.4 percent, 10.4 percent, and 7.9 percent, respectively, for those in low-, middle-, and high-income families, respectively. Across geographic census regions, a higher percentage of adults residing in the South and Midwest had any diabetes treatment (11.2% and 10.8%, respectively) compared with those residing in the Northeast and West (9.0% and 8.6%, respectively).
Average annual percentage of adults who received services for diabetes by service type (figure 3)
Among adults treated for diabetes in 2021-2022, an annual average of 95.9 percent used outpatient prescribed medicines for diabetes, and 59.5 percent had one or more visits to an office-based medical provider for diabetes. Relatively smaller proportions received diabetes treatment in the form of hospital outpatient visits (10.8%), emergency room visits (1.9%), inpatient hospital stays (0.9%), and home health services (3.1%).
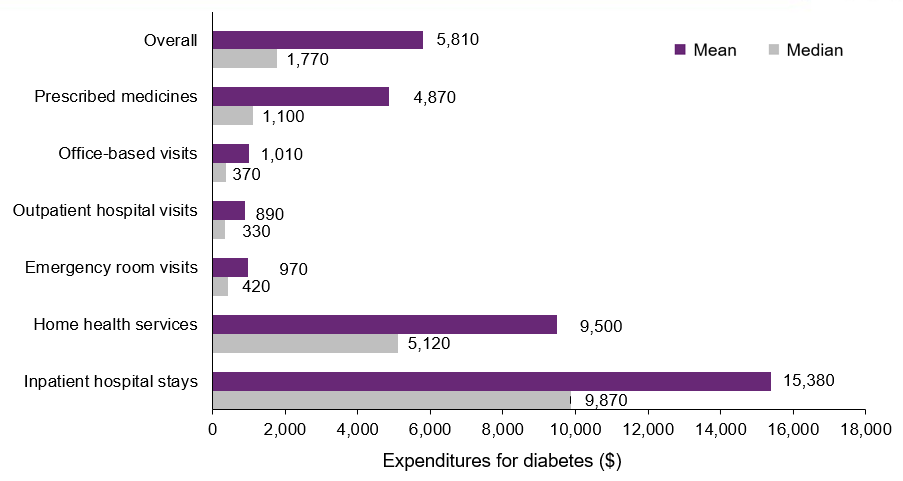
Average annual diabetes treatment expenditures overall and by type of medical service (figure 4)
Adults with treated diabetes sought and paid for various types of medical services in 2021-2022. For this group, per capita annual diabetes treatment expenditures1 had a median of $1,770 and a mean of $5,810. Prescribed medications had a median cost of $1,100 per patient per year among adults who had prescribed medications for diabetes in 2021-2022 (and an average cost of $4,870).Hospital inpatient stays were the most expensive type of service use, with an average annual cost of $15,380 per patient among those who were hospitalized for diabetes in 2021-2022 (median of $9,870 per individual). Among all service categories, outpatient hospital visits were the lowest cost service, with an average annual cost of $890 per patient among adults who had out-patient hospital visits due to diabetes in 2021-2022 (median of $330 per individual). Average annual costs were much higher than median costs for all service types because a relatively small proportion of adults had very high expenses.
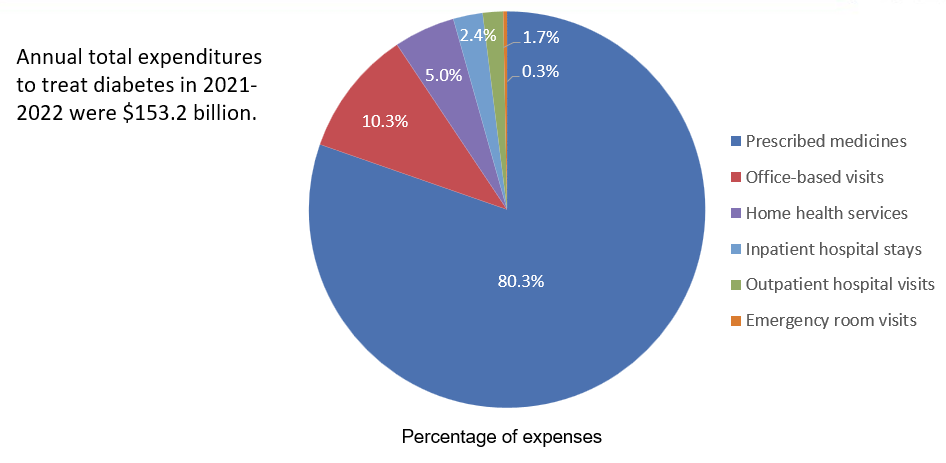
Annual percentage distribution of diabetes treatment expenses by type of medical service (figure 5)
In 2021-2022, an estimated $153.2 billion was spent annually on diabetes treatment among adults in the U.S. civilian noninstitutionalized population. The largest portion (80.3%) of these expenses were for prescription medications. Of all expenditures, 10.3 percent were for office-based visits, followed by 5.0 percent for home health services, 2.4 percent for inpatient hospital stays, 1.7 percent for outpatient hospital visits, and 0.3 percent for emergency department visits.
Annual percent distribution of diabetes treatment expenses by source of payment (figure 6)
Medicare paid the highest share of expenditures for diabetes in 2021-2022 (41.0%), followed by private health insurance (32.0%). Medicaid paid 17.2%, followed by out-of-pocket payments (6.2%), and payments by other sources (3.5%).
Data Source
This Statistical Brief uses the following 2021 and 2022 MEPS public use files: (a) Medical Conditions File (H231 & H241) (b) Condition-Event Link File (H229IF1 & H239IF1), (c) Office-Based Medical Provider Visits File (H229G & H239G), (d) Outpatient Visits File (H229F & H239F), (e) Emergency Room Visits File (H229E & H239E), (f) Prescribed Medicines File (H229A & H239A), (g) Hospital Inpatient Stays File (H229D & H239D), (h) Home Health File (H229H & H239H), and (i) Full-Year Consolidated Data File (H233 & H243). These data files are publicly available at: https://meps.ahrq.gov/data_stats/download_data_files.jsp.
Definitions
Diabetes
MEPS-HC conditions reported by households were coded into International Classification of Diseases, 10th Revision, Clinical Modification (ICD-10-CM) codes, which were then collapsed into Clinical Classifications Software Refined (CCSR) categories. The following specific CCSR categories were combined to create the broader condition category of diabetes.
- CCSR Category Description
- END002: Diabetes mellitus without complication
- END003: Diabetes mellitus with complication
- END004: Diabetes mellitus, Type 1
- END005: Diabetes mellitus, Type 2
- END006: Diabetes mellitus due to underlying condition, drug or chemical induced, or other specified type
Persons were classified as receiving any diabetes treatment if they received one or more medical services (i.e., office-based, hospital outpatient or emergency room visits, hospital inpatient stays, prescribed medicine purchases, or home health services) for diabetes identified by the CCSR categories above as being the reason for or having been discovered while receiving care.
Types of Medical Services
Office-based visits: Includes expenses for visits to medical providers (i.e., physicians and nonphysicians) seen in office-based settings and clinics during the year. For 2021-2022, this service category also includes telehealth visits (i.e., visits made to medical providers practicing in an office-based setting or clinic over the phone, through real-time video, or some other way).
Hospital outpatient visits: Includes expenses for services provided by the facility and physicians who bill separately from the facility for visits to hospital outpatient departments during the year. For 2021-2022, this service category also includes telehealth visits (i.e., visits made to medical providers practicing in a hospital outpatient department over the phone, through real-time video, or some other way).
Emergency room visits: Includes payments for services covered under the basic facility charge and those for separately billed physician services during the year. However, these payments exclude expenses for emergency room services included in an inpatient hospital bill.
Hospital inpatient stays: Includes room and board and all hospital diagnostic and laboratory expenses associated with the basic facility charge, payments for separately billed physician inpatient services, and some emergency room expenses incurred prior to inpatient stays.
Prescribed medicines: Includes expenses for all prescribed medications initially purchased or refilled during the year.
Home health services: Includes expenses for home health services provided by agencies and independent providers during the year.
Sources of Payment
Out-of-pocket: Expenses paid by the user or other family member.
Private insurance: Payments made by insurance plans covering hospital and medical care (excluding payments from Medicare, Medicaid, and other public sources). Payments from Medigap plans or TRICARE (Armed Forces-related coverage) are included.
Medicare: Payments by this federally financed health insurance program for persons age 65 and older, persons receiving Social Security disability payments, and persons with end-stage renal disease.
Medicaid/Children's Health Insurance Program (CHIP): Payments by Medicaid and CHIP, which are means-tested government programs jointly financed by federal and state funds that provide healthcare to eligible people. Medicaid is designed to provide health coverage to families and individuals who cannot afford necessary medical care, while CHIP provides coverage to additional low-income children not eligible for Medicaid. Eligibility criteria for both programs vary significantly by state.
Other sources: Includes payments from the U.S. Department of Veterans Affairs; other federal sources (Indian Health Service and other care provided by the federal government, except TRICARE); various state and local sources (community and neighborhood clinics, state and local health departments, and state programs other than Medicaid/CHIP); workers' compensation; and various unclassified sources (e.g., automobile, homeowner's, or other liability insurance, and other miscellaneous or unknown sources).
Expenditures for Diabetes Treatment
Expenses reported in this Brief were defined as associated with diabetes if a medical visit, stay, service or purchase of a prescribed medicine was for treatment of diabetes. The estimates in this Brief do not include expenditures for diabetes complications, or for other health conditions that may be impacted by diabetes. For each event, all expenditures were counted as expenditures for diabetes if the event was reported as associated with diabetes, even if other conditions were also reported. The report aggregates diabetes treatment costs across service categories to create a person-level total for each payment source. It also aggregates diabetes treatment costs at the individual level for each of the six medical services and for all services combined. In producing average estimates for 2021-2022, 2021 expenses were adjusted to 2022 dollars, using the Bureau of Economic Analysis' Personal Consumption Expenditure Price Index-Health (https://meps.ahrq.gov/about_meps/Price_Index.shtml).
Age
Individuals were classified into three age groups (i.e., 18-44, 45-64, and 65 and older). Age was defined as age at the end of the year 2021-2022 (or on last date of MEPS eligibility if the person was out of scope at the end of the year).
Sex
Sex was defined with two mutually exclusive categories as either male or female.
Race/Ethnicity
MEPS respondents were asked if each family member was Hispanic or Latino and about each member's race. Based on this information, categories of race and Hispanic origin were constructed as follows: Hispanic; White, non-Hispanic with no other race reported; Black, non-Hispanic with no other race reported; and Asian, non-Hispanic, with no other race reported. The "other/multiple races, non-Hispanic" category is not shown separately in this Brief due to small sample sizes or failure to meet minimum precision requirements. However, those individuals are included in estimates for the overall population.
Family Income
Family income was classified into the following four categories based on the ratio of total family income to the federal poverty line (FPL), adjusted for family size and composition:
- Poor (less than 125 percent of FPL)
- Low income (125 percent to less than 200 percent of FPL)
- Middle income (200 percent to less than 400 percent of FPL)
- High income (greater than or equal to 400 percent of FPL)
Census Region
Census region (categories shown below) was based on the location of the household at the end of the year. If missing at the end of the year, the location from a previous MEPS data collection round was used.
Northeast: Maine, New Hampshire, Vermont, Massachusetts, Rhode Island, Connecticut, New York, New Jersey, and Pennsylvania
Midwest: Ohio, Indiana, Illinois, Michigan, Wisconsin, Minnesota, Iowa, Missouri, North Dakota, South Dakota, Nebraska, and Kansas
South: Delaware, Maryland, District of Columbia, Virginia, West Virginia, North Carolina, South Carolina, Georgia, Florida, Kentucky, Tennessee, Alabama, Mississippi, Arkansas, Louisiana, Oklahoma, and Texas
West: Montana, Idaho, Wyoming, Colorado, New Mexico, Arizona, Utah, Nevada, Washington, Oregon, California, Alaska, and Hawaii
About MEPS
The Medical Expenditure Panel Survey Household Component (MEPS-HC) collects nationally representative data on health care use, expenditures, sources of payment, and insurance coverage for the U.S. civilian noninstitutionalized population. The MEPS-HC is cosponsored by the Agency for Healthcare Research and Quality (AHRQ) and the National Center for Health Statistics (NCHS). More information about the MEPS-HC can be found on the MEPS Web site at https://meps.ahrq.gov/.
Notes
1 These expenditures are the sum of the treatment costs across medical service categories for diabetes, excluding dental visits and other medical equipment and services (e.g., eyeglasses, contact lenses, ambulance services, orthopedic items, hearing devices).
References
Borén J, Öörni K, Catapano AL. The link between diabetes and cardiovascular disease. Atherosclerosis. 2024 Jul;394:117607. doi: 10.1016/j.atherosclerosis.2024.117607. Epub 2024 May 29. PMID: 38824007.
Center for Disease Control and Prevention. National Diabetes Statistics Report. Atlanta, GA: Centers for Disease Control and Prevention, US Dept of Health and Human Services; 2022. https://www.cdc.gov/diabetes/php/data-research/index.html
Deshpande AD, Harris-Hayes M, Schootman M. Epidemiology of diabetes and diabetes-related complications. Phys Ther. 2008 Nov;88(11):1254-64. doi: 10.2522/ptj.20080020. Epub 2008 Sep 18. PMID: 18801858; PMCID: PMC3870323.
Gwira JA, Fryar CD, Gu Q. Prevalence of total, diagnosed, and undiagnosed diabetes in adults: United States, August 2021-August 2023. NCHS Data Brief, no 516. Hyattsville, MD: National Center for Health Statistics. 2024. DOI: https://dx.doi.org/10.15620/cdc/165794.
Parker ED, Lin J, Mahoney T, Ume N, Yang G, Gabbay RA, ElSayed NA, Bannuru RR, Economic Costs of Diabetes in the U.S. in 2022. Diabetes Care 2 January 2024; 47 (1): 26-43.
Suggested Citation
Berdahl, T. A. & Moriya, A. S. Healthcare Expenditures for Diabetes among Adults Aged 18 and Older in the U.S. Civilian Noninstitutionalized Population, 2021-2022. Statistical Brief #568. AHRQ Publication No. 25-0091. December 2025. Agency for Healthcare Research and Quality, Rockville, MD. https://meps.ahrq.gov/data_files/publications/st568/stat568.shtml
AHRQ welcomes questions and comments from readers of this publication who are interested in obtaining more information about access, cost, use, financing, and quality of healthcare in the United States. We also invite you to tell us how you are using this Statistical Brief and other MEPS data and tools and to share suggestions on how MEPS products might be enhanced to further meet your needs. Please email us at MEPSProjectDirector@ahrq.hhs.govor send a letter to the address below:
Samuel H. Zuvekas, PhD, Acting Director
Center for Financing, Access and Cost Trends
Agency for Healthcare Research and Quality
5600 Fishers Lane, Mailstop 07W01C
Rockville, MD 20857
Figures
Figure 1. Percentage of adults aged 18 and older who received any diabetes treatment by demographic characteristics, 2021-2022
| Category | Subcategory | Percentage (%) |
|---|---|---|
| All | All | 10.2 |
| Age | 18-44 | 2.5 |
| 45-64 | 12.7 | |
| 65+ | 21.6 | |
| Race/Ethnicity | White, non-Hispanic | 9.5 |
| Black, non-Hispanic | 12.9 | |
| Asian, non-Hispanic | 10.2 | |
| Hispanic | 9.8 | |
| Sex | Male | 10.7 |
| Female | 9.6 |
Source: Center for Financing, Access, and Cost Trends, AHRQ, Household Component of the Medical Expenditure Panel Survey, 2021-2022.
Figure 2. Percentage of adults aged 18 and older who received any diabetes treatment by income and region, 2021-2022
| Category | Subcategory | Percentage (%) |
|---|---|---|
| All | All | 10.2 |
| Family income | Poor | 14.9 |
| Low income | 12.4 | |
| Middle income | 10.4 | |
| High income | 7.9 | |
| Census Region | Northeast | 9.0 |
| South | 11.2 | |
| Midwest | 10.8 | |
| West | 8.6 |
Source: Center for Financing, Access, and Cost Trends, AHRQ, Household Component of the Medical Expenditure Panel Survey, 2021-2022.
Figure 3. Percentage who received various medical services for diabetes among adults aged 18 and older treated for diabetes, 2021-2022

| Category | Percentage (%) |
|---|---|
| Office-based visits | 59.5 |
| Outpatient hospital visits | 10.8 |
| Emergency room visits | 1.9 |
| Inpatient hospital stays | 0.9 |
| Home health services | 3.1 |
| Prescribed medicines | 95.9 |
Source: Center for Financing, Access, and Cost Trends, AHRQ, Household Component of the Medical Expenditure Panel Survey, 2021-2022.
Figure 4. Mean and median annual expenditures per person for diabetes treatment, overall and by type of medical service, among adults aged 18 and older treated for diabetes, 2021-2022
| Expenditures | Mean ($) | Median ($) |
|---|---|---|
| Overall | 5,810 | 1,770 |
| Prescribed medicines | 4,870 | 1,100 |
| Office-based visits | 1,010 | 370 |
| Outpatient hospital visits | 890 | 330 |
| Emergency room visits | 970 | 420 |
| Home health services | 9,500 | 5,120 |
| Inpatient hospital stays | 15,380 | 9,870 |
Note: The estimates are conditional on the receipt of each type of services and are rounded to the nearest ten dollars.
Source: Center for Financing, Access, and Cost Trends, AHRQ, Household Component of the Medical Expenditure Panel Survey, 2021-2022.
Figure 5. Percentage distribution of diabetes treatment expenses by type of medical service among adults aged 18 and older treated for diabetes, 2021-2022
| Type of medical service | Percentage (%) |
|---|---|
| Prescribed medicines | 80.3 |
| Office-based visits | 10.3 |
| Home health services | 5.0 |
| Inpatient hospital stays | 2.4 |
| Outpatient hospital visits | 1.7 |
| Emergency room visits | 0.3 |
Source: Center for Financing, Access, and Cost Trends, AHRQ, Household Component of the Medical Expenditure Panel Survey, 2021-2022.
Figure 6. Percentage distribution of diabetes treatment expenses by source of payment among adults aged 18 and older treated for diabetes, 2021-2022
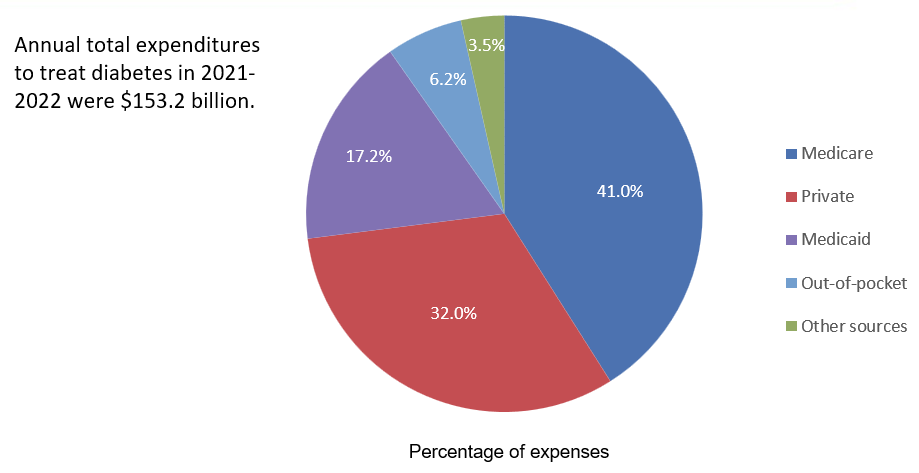
| Source of payment | Percentage (%) |
|---|---|
| Medicare | 41.0 |
| Private | 32.0 |
| Medicaid | 17.2 |
| Out-of-pocket | 6.2 |
| Other sources | 3.5 |
Source: Center for Financing, Access, and Cost Trends, AHRQ, Household Component of the Medical Expenditure Panel Survey, 2021-2022.
AHRQ Pub. No. 25-0091
December 2025