Skip to main content
|
||||||||||||||
|
|
||||||||||||||
RESEARCH FINDINGS #51:
|
||||||||||||||||||||||||||||||||||||||||||||||||||||||||||||||||||||||||||||||||||||||||||||||||||||||||||||
| September 2024 | ||||||||||||||||||||||||||||||||||||||||||||||||||||||||||||||||||||||||||||||||||||||||||||||||||||||||||||
|
Anita Soni, PhD, MBA, G. Edward Miller, PhD, and Patricia S. Keenan, PhD
|
||||||||||||||||||||||||||||||||||||||||||||||||||||||||||||||||||||||||||||||||||||||||||||||||||||||||||||
Highlights
|
||||||||||||||||||||||||||||||||||||||||||||||||||||||||||||||||||||||||||||||||||||||||||||||||||||||||||||
AbstractEmployer-sponsored insurance (ESI) is the primary source of health insurance coverage for individuals under age 65 in the United States. This Research Findings report uses pooled 2021–2023 Medical Expenditure Panel Survey Insurance Component data to examine state-level variation in key aspects of private-sector ESI benefits, including offers, coverage, premiums, employee contributions, deductibles, and high-deductible health plans, compared to national averages. State-level analyses can provide insights into workers' access to ESI and the costs that may be incurred by employers (through premiums) and workers (through employee out-of-pocket premiums and deductibles). |
||||||||||||||||||||||||||||||||||||||||||||||||||||||||||||||||||||||||||||||||||||||||||||||||||||||||||||
IntroductionEmployer-sponsored insurance (ESI) is the primary source of health insurance coverage for individuals under age 65 in the United States. This Research Findings report uses Medical Expenditure Panel Survey Insurance Component (MEPS-IC) data to examine state-level variation in key aspects of private-sector ESI benefits, including offers, coverage, premiums, employee contributions, deductibles, and high-deductible health plans (HDHPs). Examining state variations is important because ESI can differ substantially across states, compared to national averages. State-level analyses can thus provide insights into workers' access to ESI and the costs that may be incurred by employers (through premiums) and workers (through employee out-of-pocket premiums and deductibles). From the employee perspective, premium contributions are known costs that may affect take-up of insurance, while deductibles reflect potential costs that may affect use of healthcare services and, particularly in the case of HDHPs, expose individuals and families to high levels of potential out-of-pocket spending that may cause financial strain. State variations in ESI markets may reflect differences in employment patterns such as firm size, industry composition, and unionization; differing levels of healthcare prices and utilization; and differences in state approaches to regulating private insurance and administering Medicaid. For example, firm size is a key determinant of whether firms offer health insurance, with lower offer rates among smaller compared to larger employers due to smaller firms' more limited ability to pool risk and their higher administrative costs. Cross-state differences in the extent of small firm employment may thus contribute to differences in ESI offer rates across states. Differences in premiums across states may reflect a combination of variations in healthcare prices and utilization patterns, along with variations in benefit generosity such as deductible levels. This Research Findings report uses pooled 2021–2023 MEPS-IC data. The MEPS-IC is an annual survey of private employers and state and local governments and is designed to be representative of all 50 states and the District of Columbia. (For purposes of the analyses presented in this report, the District of Columbia is treated as a state.) This report focuses on state-level variation in key aspects of ESI in the private sector. The large sample size (about 42,000 private-sector establishments), combined with a response rate of 52.9 percent in 2023, permits analyses of variations in ESI by firm size and across states that are not readily available from other sources. In the pooled data, estimates of dollar values are inflation-adjusted to 2022. The maps show state differences relative to the national mean. The solid shaded colors show statistically significant differences above (in blue) and below (in green) the national mean, at the 0.05 significance level. The diagonal stripes show point estimates above (diagonal blue stripes) and below (green diamond pattern) that are not statistically different from the national mean. |
||||||||||||||||||||||||||||||||||||||||||||||||||||||||||||||||||||||||||||||||||||||||||||||||||||||||||||
FindingsHealth insurance offer and coverage rates (figures 1–3)This section presents estimates of the percentage of employees that worked in establishments that offered insurance (the "offer rate") for all private-sector establishments (figure 1) and for small-firm establishments with fewer than 50 employees (figure 2). This section also presents estimates of the "coverage rate" (figure 3), which is the percentage of all employees enrolled in their employer's health insurance plan at establishments that offered health insurance. The coverage rate is equal to the eligibility rate (the percentage of employees eligible for health insurance) multiplied by the take-up rate (the percentage of eligible employees who enrolled). In 2021–2023, the offer rate was 85.4 percent for all private-sector employees (figure 1) and 50.7 percent for small-firm employees (figure 2). The offer rate showed substantial variation across the United States, ranging from a low of 69.8 percent in Wyoming to a high of 95.8 percent in Hawaii for all employees, and from 29.0 percent in Alaska to 88.7 percent in Hawaii among small-firm employees. In 2021–2023, the average annual coverage rate was 55.3 percent for all private-sector employees (figure 3). Compared to offer rates, coverage rates show somewhat less variation, ranging from a low of 46.6 percent in New York to a high of 62.5 percent in Hawaii. For 10 states (Alaska, Arkansas, Idaho, Montana, Nebraska, New Mexico, North Carolina, South Carolina, Utah, and Wyoming) the offer rates for all employees and for small-firm employees were both lower than the national average, and for eight states (Alabama, California, the District of Columbia, Hawaii, Illinois, Massachusetts, Missouri, and Virginia) the offer rates for all employees and for small-firm employees were both higher than the national average. Seven states (Maryland, New Mexico, New York, Rhode Island, Vermont, West Virginia, and Wisconsin) had coverage rates below the national average, and nine states (Alabama, Arkansas, California, the District of Columbia, Hawaii, Kentucky, Montana, Oregon, and Washington) had coverage rates above the national average. Multiplying the offer rate (figure 1) by the coverage rate (figure 3) provides an estimate of the average annual enrollment rate (percentage of all employees enrolled in a health insurance plan from their employer including employees in establishments that do and do not offer health insurance). In 2021–2023, the national enrollment rate was 47.2 percent (data not shown). New Mexico and Vermont, which had offer and coverage rates that were both below the national average, had the lowest enrollment rates (38.8 and 39.0 percent, respectively). Alabama, the District of Columbia, and Hawaii, which had offer and coverage rates that were both above the national average, had the highest enrollment rates (52.3, 55.8, and 59.9 percent, respectively). Premiums (figures 4–6)This section presents estimates of total health insurance premiums (i.e., the amount of premiums paid by employees plus the amount paid by employers on behalf of their employees) for single, employee-plus-one, and family coverage. For the years 2021–2023, national average annual health insurance premiums per enrolled employee with a private-sector employer were $7,683 for single coverage, $15,145 for employee-plus-one coverage, and $22,263 for family coverage (figures 4, 5, and 6). For single coverage, 12 states with average annual premiums ranging from $8,161 in Rhode Island to $8,850 in New York were above the national average, and 14 states with average annual premiums ranging from $6,853 in Arkansas to $7,386 in Kentucky were below the national average (figure 4). For employee-plus-one coverage, 13 states with average annual premiums ranging from $15,915 in Wyoming to $17,518 in Alaska were above the national average, and 14 states with average annual premiums ranging from $13,526 in Arkansas to $14,583 in Iowa were below the national average (figure 5). For family coverage, 10 states with average annual premiums ranging from $23,142 in Maine to $24706 in Alaska were above the national average, and 13 states with average annual premiums ranging from $19,534 in Arkansas to $20,986 in Tennessee were below the national average (figure 6). In 2021–2023, six states in the Northeast region of the United States—Connecticut, Massachusetts, New Hampshire, New Jersey, New York, and Vermont—had average annual premiums for single, employee-plus-one, and family coverage that were all above the national average, and two additional Northeastern states—Maine and Rhode Island—had average annual premiums higher than the national average for two of the three types of coverage. There were also three states outside the Northeast region—Alaska, the District of Columbia, and West Virginia—with higher average annual premiums for all three types of coverage. In 2021–2023, 11 states—Alabama, Arkansas, Hawaii, Idaho, Kansas, Louisiana, Mississippi, Nevada, Oklahoma, South Carolina, and Tennessee—had average annual premiums for single, employee-plus-one, and family coverage that were all below the national average. Seven of these states are in the Southern region of the United States. Employee contributions (figures 7–9)This section presents the national average employee contributions for annual health insurance per enrolled employee with a private-sector employer for the years 2021–2023. Nationally, the average annual employee contributions were $1,628 for single coverage, $4,274 for employee-plus-one coverage, and $6,474 for family coverage (figures 7, 8, and 9). For single coverage, 13 states with average annual employee contributions ranging from $1,770 in Tennessee to $1,987 in Vermont were above the national average, and eight states with average annual employee contributions ranging from $990 in Hawaii to $1,492 in Oklahoma were below the national average (figure 7). Some regional clustering was evident as five of six New England states—Connecticut, Massachusetts, New Hampshire, Rhode Island, and Vermont—and two of three mid-Atlantic states—New Jersey and New York—had average annual employee contributions above the national average. For employee-plus-one coverage, five states with average annual employee contributions ranging from $4,689 in Florida to $5,045 in North Carolina were above the national average, and eight states with average annual employee contributions ranging from $3,427 in Oregon to $3,972 in Maine were below the national average (figure 8). For family coverage, six states with average annual employee contributions ranging from $6,970 in California to $7,416 in Arizona were above the national average, and 11 states with average annual employee contributions ranging from $5,030 in Michigan to $5,830 in Nevada were below the national average (figure 9). In contrast to premiums, there was very little consistency across coverage types in which states had average annual employee contributions above or below the national average. The state of Oregon had average annual employee contributions that were lower than the national average for all three types of coverage, and no states had average annual employee contributions that were above the national average for all three types of coverage. Individual and family deductibles (figures 10–12)This section presents estimates of the percentage of ESI enrollees with a deductible (figure 10) and average individual and family deductibles among enrollees with a deductible (figures 11 and 12). The individual and family deductibles reported in this section are annual deductibles that must be met before many services are covered by the health plan. In 2021–2023, the average annual percentage of private-sector ESI enrollees in a health insurance plan with a deductible was 89.0 percent across all states and ranged from a low of 43.0 percent in Hawaii to 98.4 percent in Montana (figure 10). In five states (California, the District of Columbia, Hawaii, Massachusetts, and New York) the percentage of enrollees with a deductible was significantly lower than the national average. In 36 states, the percentage with a deductible was higher than the national average. Among enrollees with a deductible in 2021–2023, the average annual individual deductible for all private-sector enrollees in a health insurance plan with a deductible was $1,960, and the average annual family deductible was $3,772. Thirteen states, with average deductibles ranging from $1,203 in Hawaii to $1,817 in Arkansas, had average individual deductibles below the national average, and 17 states, with deductibles ranging from $2,119 in Colorado to $2,543 in Maine, had average individual deductibles above the national average (figure 11). Nine states, with deductibles ranging from $2,927 in the District of Columbia to $3,471 in California, had average family deductibles below the national average, and 16 states, with deductibles ranging from $4,027 in Iowa to $4,549 in South Dakota, had average family deductibles above the national average (figure 12). For six states (Arkansas, California, the District of Columbia, Hawaii, Michigan, and Pennsylvania) average annual individual and family deductibles were both below the national average. New York nearly makes this list, but the difference in family deductibles is significant only at the p < 0.10 level. Notably, California, the District of Columbia, Hawaii, and New York were also four of the five states in which the percentage of enrollees with a deductible was significantly lower than the national average, meaning that the deductible obligations of enrollees in those states would be even lower compared to other states if we considered the share of enrollees with no (zero) deductibles. High-deductible health plans (figures 13–16)This section presents estimates of the percentage of ESI enrollees with single and family coverage that were enrolled in HDHPs (figures 13 and 14) and average individual and family deductibles among HDHP enrollees (figures 15 and 16). Health insurance plans are classified as "high-deductible" if the annual deductible meets or exceeds the Internal Revenue Service (IRS) threshold for a high-deductible plan in a given year. In 2023, the deductible threshold was $1,500 for single coverage and $3,000 for family coverage. In 2021–2023, among private-sector employees in single coverage plans, 57.4 percent, on average, were enrolled in HDHPs. Eight states, with HDHP enrollment rates ranging from 17.1 percent in Hawaii to 51.0 percent in Pennsylvania, were below the national average, and 25 states, with HDHP enrollment rates ranging from 62.6 percent in Missouri to 78.7 percent in South Dakota, were above the national average (figure 13). Results were similar for family coverage, with 57.3 percent of family enrollees, overall, in HDHPs. Eight states, with HDHP enrollment rates ranging from 20.5 percent in Hawaii to 52.4 percent in New York, were below the national average, and 16 states, with HDHP enrollment rates ranging from 63.6 percent in Tennessee to 69.7 percent in South Dakota, were above the national average (figure 14). Six states—California, the District of Columbia, Hawaii, Nevada, New York, and Pennsylvania—had HDHP enrollment rates that were below the national average for both single and family coverage. Among HDHP enrollees, the average annual individual and family deductibles were $2,647 and $5,081, respectively. Eleven states, with average individual deductibles ranging from $2,302 in Michigan to $2,519 in Illinois and Pennsylvania, were below the national average, and 12 states, with average individual deductibles ranging from $2,775 in Iowa to $3,165 in Montana, were above the national average (figure 15). Among HDHP enrollees with family coverage, three states—Michigan ($4,445), New York ($4,663), and Pennsylvania ($4,790)—had average family deductibles below the national average, and 12 states, with deductibles ranging from $5,326 in Minnesota to $5,725 in Oklahoma, had average family deductibles above the national average (figure 16). New York and Pennsylvania were the only two states in the country with lower HDHP enrollment rates for both single and family coverage, and lower average individual and family deductibles among HDHP enrollees. Similarly, New Hampshire, South Dakota, and Texas were the only three states with higher HDHP enrollment rates for both single and family coverage, and higher average individual and family deductibles among HDHP enrollees. |
||||||||||||||||||||||||||||||||||||||||||||||||||||||||||||||||||||||||||||||||||||||||||||||||||||||||||||
Data SourceThe estimates in the Research Findings are based on 2021–2023 private-sector establishment data from MEPS-IC. |
||||||||||||||||||||||||||||||||||||||||||||||||||||||||||||||||||||||||||||||||||||||||||||||||||||||||||||
DefinitionsHealth insurance plan Premium Single coverage Employee-plus-one coverage Family coverage Employee contribution Deductible Enrollment rate Offer rate High-deductible health plan Coverage rate |
||||||||||||||||||||||||||||||||||||||||||||||||||||||||||||||||||||||||||||||||||||||||||||||||||||||||||||
About MEPS-ICThe MEPS-IC is a survey of private-sector business establishments and state and local governments that collects information on employer-sponsored health insurance, such as whether insurance is offered, enrollments, types of plans, and premiums. The survey is conducted annually by the U.S. Census Bureau under the sponsorship of the Agency for Healthcare Research and Quality (AHRQ). More information about the MEPS-IC can be found on the MEPS website at https://meps.ahrq.gov/. |
||||||||||||||||||||||||||||||||||||||||||||||||||||||||||||||||||||||||||||||||||||||||||||||||||||||||||||
Suggested CitationSoni A, Miller GE, Keenan PS. Health Insurance Benefits at Private Employers: Pooled State-Level Estimates, 2021–2023. Research Findings #51. AHRQ Publication No. 24-0083-2-EF. Rockville, MD: Agency for Healthcare Research and Quality; September 2024. https://meps.ahrq.gov/data_files/publications/rf51/rf51.shtmlAHRQ welcomes questions and comments from readers of this publication who are interested in obtaining more information about access, cost, use, financing, and quality of healthcare in the United States. We also invite you to tell us how you are using this Statistical Brief and other MEPS data and tools and to share suggestions on how MEPS products might be enhanced to further meet your needs. Please email us at MEPSProjectDirector@ahrq.hhs.gov or send a letter to the address below: Joel W. Cohen, PhD, Director Center for Financing, Access and Cost Trends Agency for Healthcare Research and Quality 5600 Fishers Lane, Mailstop 07W41A Rockville, MD 20857 |
||||||||||||||||||||||||||||||||||||||||||||||||||||||||||||||||||||||||||||||||||||||||||||||||||||||||||||
ReferencesMedical Expenditure Panel Survey Insurance Component: Technical Notes and Survey Documentation. Rockville, MD: Agency for Healthcare Research and Quality. https://meps.ahrq.gov/survey_comp/ic_technical_notes.shtml Davis, K. Sample Design of the 2020 Medical Expenditure Panel Survey Insurance Component. Methodology Report #34. Rockville, MD: AHRQ; August 2021. https://meps.ahrq.gov/data_files/publications/mr34/mr34.pdf Medical Expenditure Panel Survey Insurance Component 2022 Chartbook. AHRQ Publication No. 23(24)-0077. Rockville, MD: AHRQ; October 2023. https://meps.ahrq.gov/data_files/publications/cb27/cb27.pdf Census Regions and Divisions of the United States: https://www2.census.gov/geo/pdfs/maps-data/maps/reference/us_regdiv.pdf |
||||||||||||||||||||||||||||||||||||||||||||||||||||||||||||||||||||||||||||||||||||||||||||||||||||||||||||
Figure 1. Offer rate: Percentage of private-sector employees in establishments that offer health insurance, by state, 3-year average, 2021–2023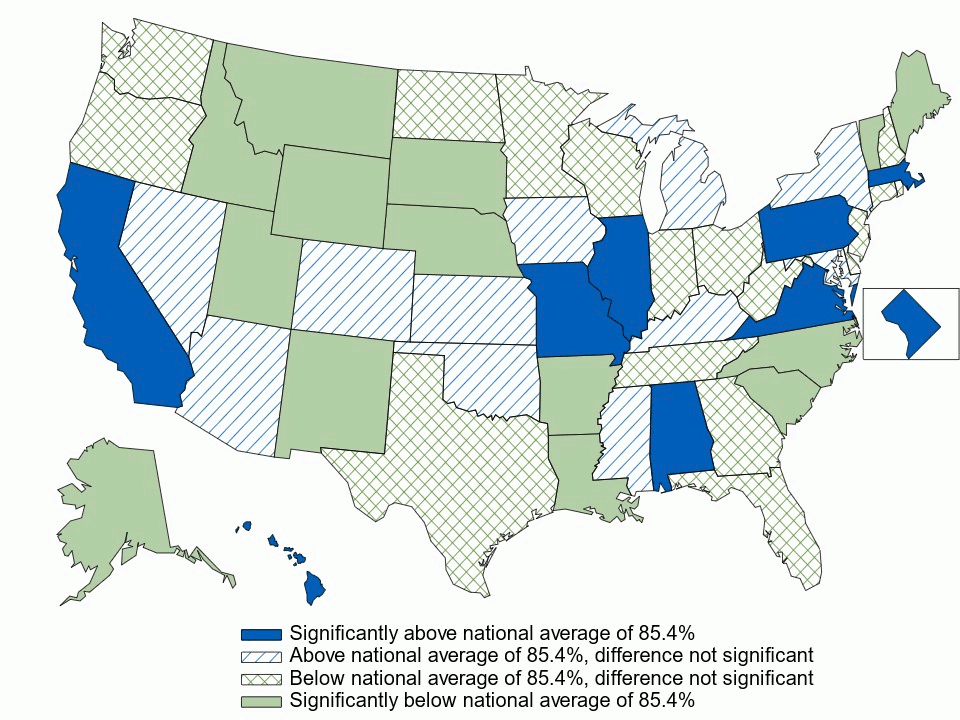
Source: Center for Financing, Access, and Cost Trends, Agency for Healthcare Research and Quality, Medical Expenditure Panel Survey Insurance Component, private-sector establishments, 2021–2023. Note: * Indicates the estimate is statistically different from the national average of 85.4% at p < 0.05. |
||||||||||||||||||||||||||||||||||||||||||||||||||||||||||||||||||||||||||||||||||||||||||||||||||||||||||||
Figure 2. Offer rate: Percentage of private-sector employees in establishments that offer health insurance, by state, firm size < 50 employees, 3-year average, 2021–2023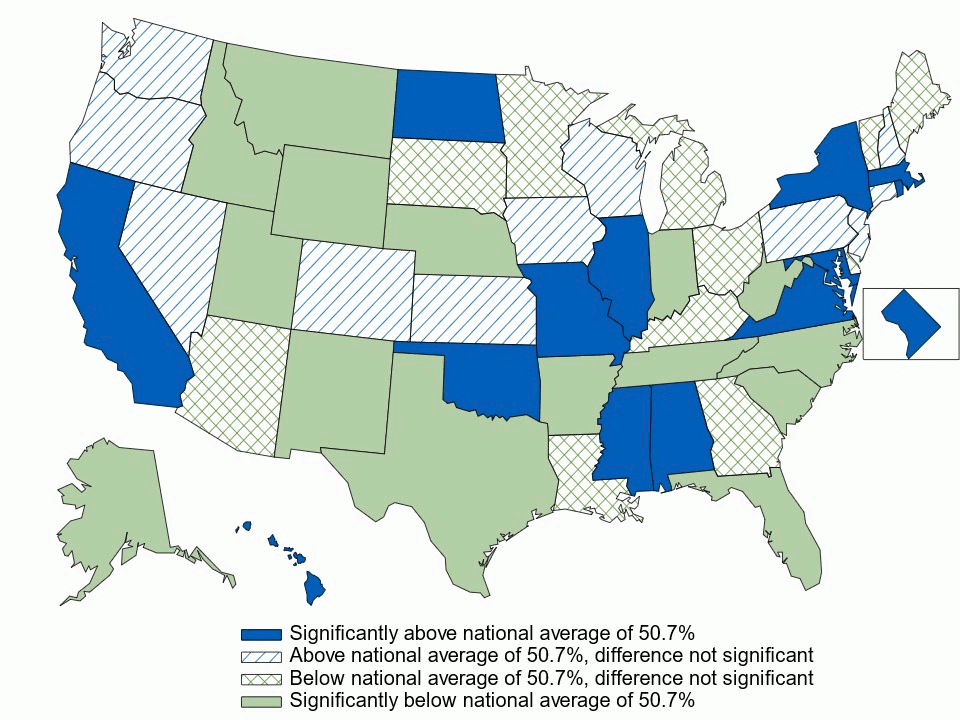
Source: Center for Financing, Access, and Cost Trends, Agency for Healthcare Research and Quality, Medical Expenditure Panel Survey Insurance Component, private-sector establishments, 2021–2023. Note: * Indicates the estimate is statistically different from the national average of 50.7% at p < 0.05. |
||||||||||||||||||||||||||||||||||||||||||||||||||||||||||||||||||||||||||||||||||||||||||||||||||||||||||||
Figure 3. Coverage rate: Percentage of private-sector employees who are enrolled in health insurance at establishments that offer health insurance, by state, 3-year average, 2021–2023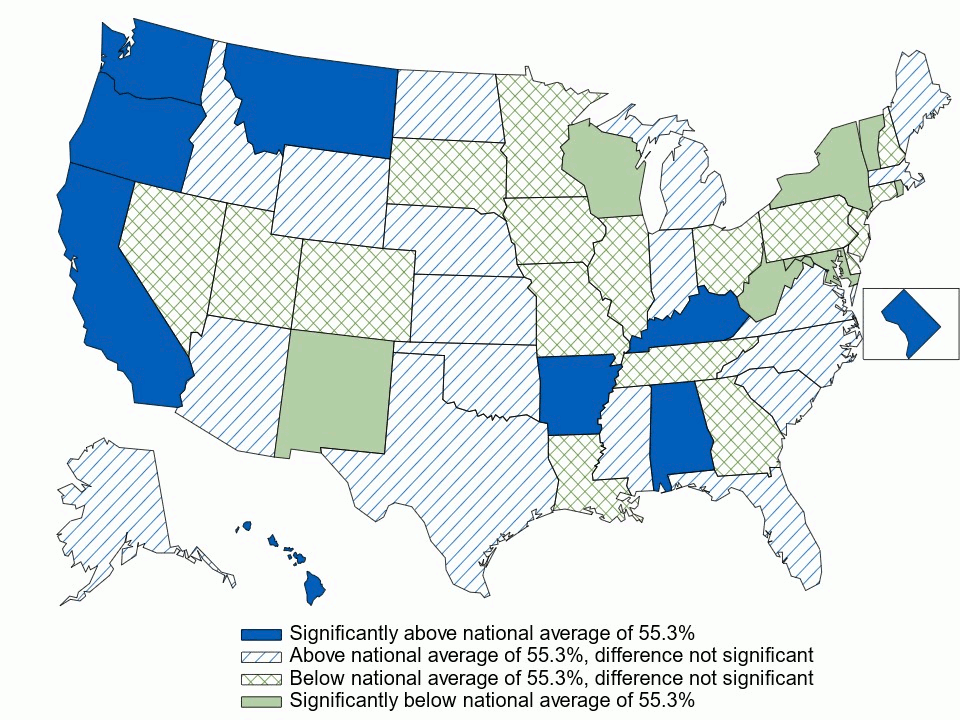
Source: Center for Financing, Access, and Cost Trends, Agency for Healthcare Research and Quality, Medical Expenditure Panel Survey Insurance Component, private-sector establishments, 2021–2023. Note: * Indicates the estimate is statistically different from the national average of 55.3% at p < 0.05. |
||||||||||||||||||||||||||||||||||||||||||||||||||||||||||||||||||||||||||||||||||||||||||||||||||||||||||||
Figure 4. Average total single premium (in dollars) per enrolled employee, by state, 3-year average, 2021–2023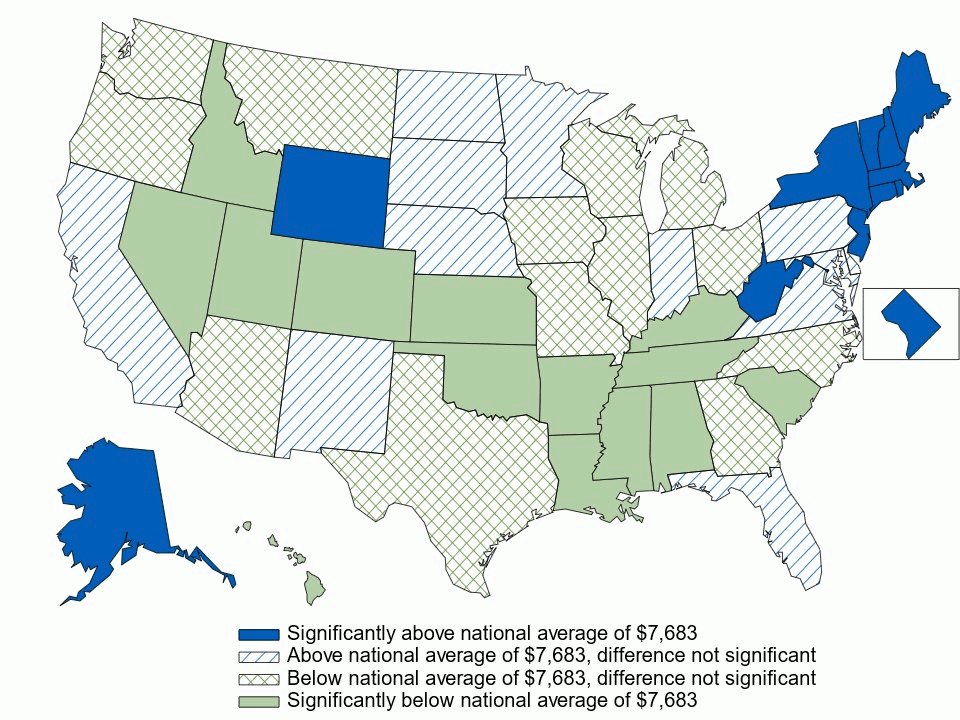
Source: Center for Financing, Access, and Cost Trends, Agency for Healthcare Research and Quality, Medical Expenditure Panel Survey Insurance Component, private-sector establishments, 2021–2023. Note: * Indicates the estimate is statistically different from the national average of $7,683 at p < 0.05. |
||||||||||||||||||||||||||||||||||||||||||||||||||||||||||||||||||||||||||||||||||||||||||||||||||||||||||||
Figure 5. Average total employee-plus-one (in dollars) premium per enrolled employee, by state, 3-year average, 2021–2023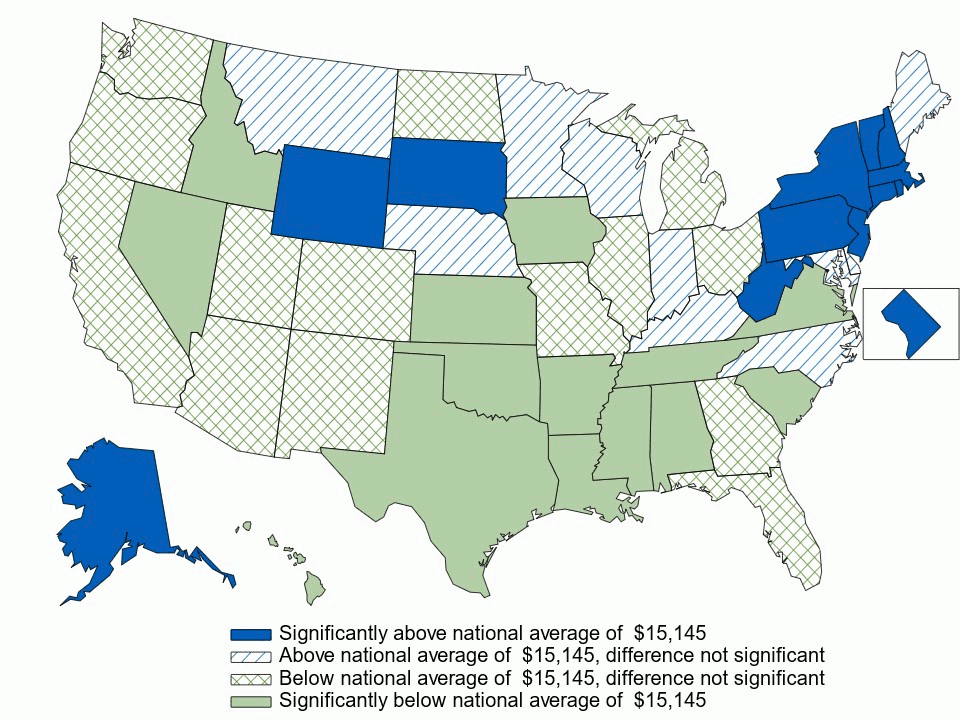
Source: Center for Financing, Access, and Cost Trends, Agency for Healthcare Research and Quality, Medical Expenditure Panel Survey Insurance Component, private-sector establishments, 2021–2023. Note: * Indicates the estimate is statistically different from the national average of $15,145 at p < 0.05. |
||||||||||||||||||||||||||||||||||||||||||||||||||||||||||||||||||||||||||||||||||||||||||||||||||||||||||||
Figure 6. Average total family premium (in dollars) per enrolled employee, by state, 3-year average, 2021–2023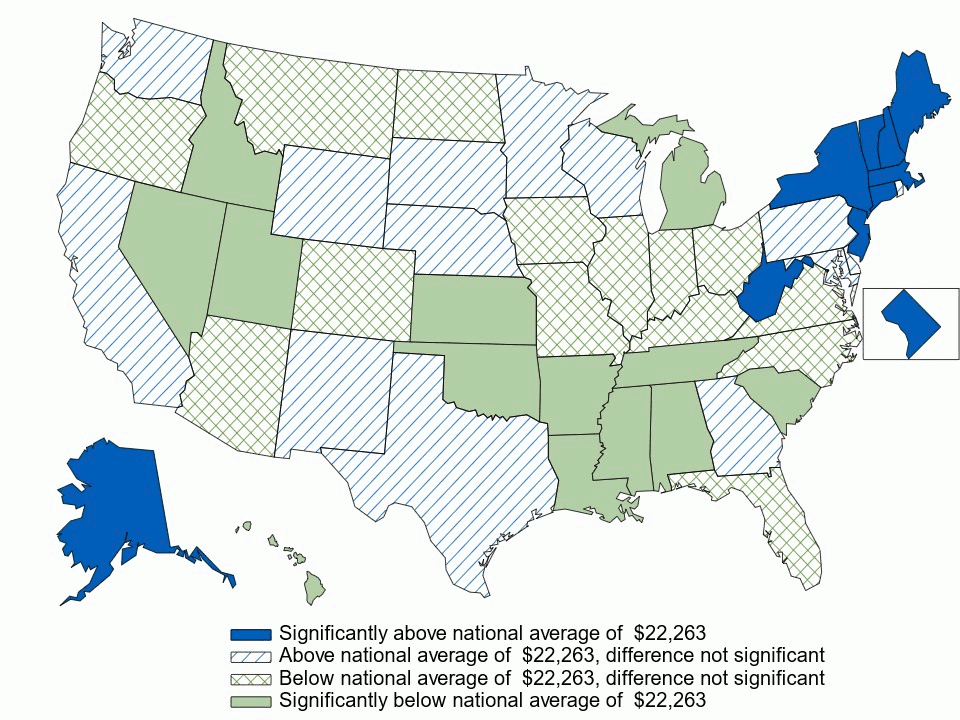
Source: Center for Financing, Access, and Cost Trends, Agency for Healthcare Research and Quality, Medical Expenditure Panel Survey Insurance Component, private-sector establishments, 2021–2023. Note: * Indicates the estimate is statistically different from the national average of $22,263 at p < 0.05. |
||||||||||||||||||||||||||||||||||||||||||||||||||||||||||||||||||||||||||||||||||||||||||||||||||||||||||||
Figure 7. Average annual employee contribution (in dollars) for single coverage, by state, 3-year average, 2021–2023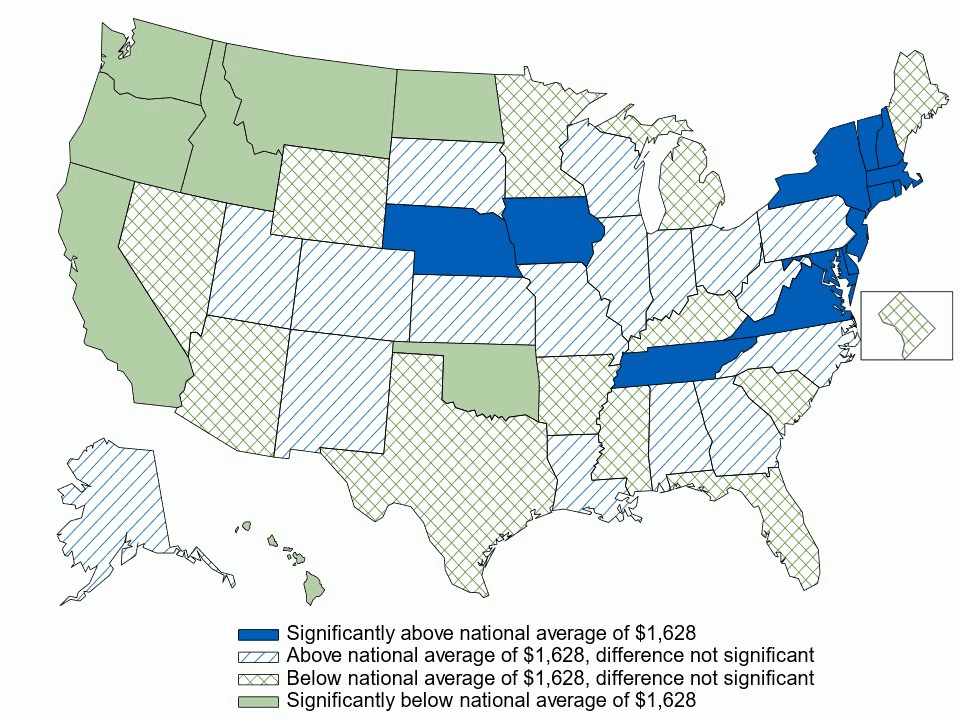
Source: Center for Financing, Access, and Cost Trends, Agency for Healthcare Research and Quality, Medical Expenditure Panel Survey Insurance Component, private-sector establishments, 2021–2023. Note: * Indicates the estimate is statistically different from the national average of $1,628 at p < 0.05. |
||||||||||||||||||||||||||||||||||||||||||||||||||||||||||||||||||||||||||||||||||||||||||||||||||||||||||||
Figure 8. Average annual employee contribution (in dollars) for employee-plus-one coverage, by state, 3-year average, 2021–2023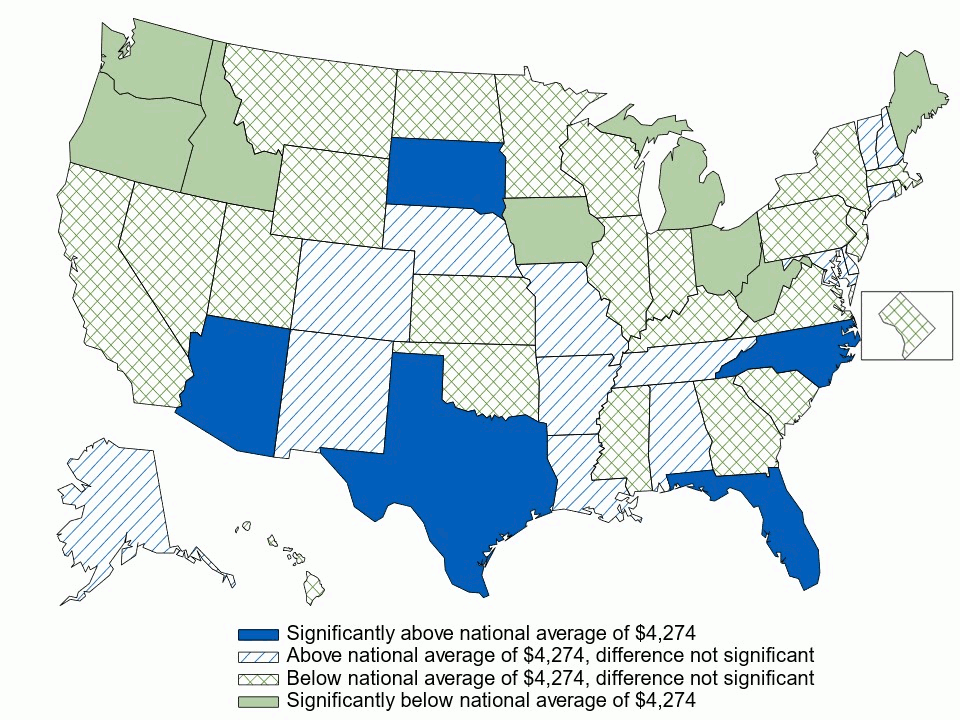
Source: Center for Financing, Access, and Cost Trends, Agency for Healthcare Research and Quality, Medical Expenditure Panel Survey Insurance Component, private-sector establishments, 2021–2023. Note: * Indicates the estimate is statistically different from the national average of $4,274 at p < 0.05. |
||||||||||||||||||||||||||||||||||||||||||||||||||||||||||||||||||||||||||||||||||||||||||||||||||||||||||||
Figure 9. Average annual employee contribution (in dollars) for family coverage, by state, 3-year average, 2021–2023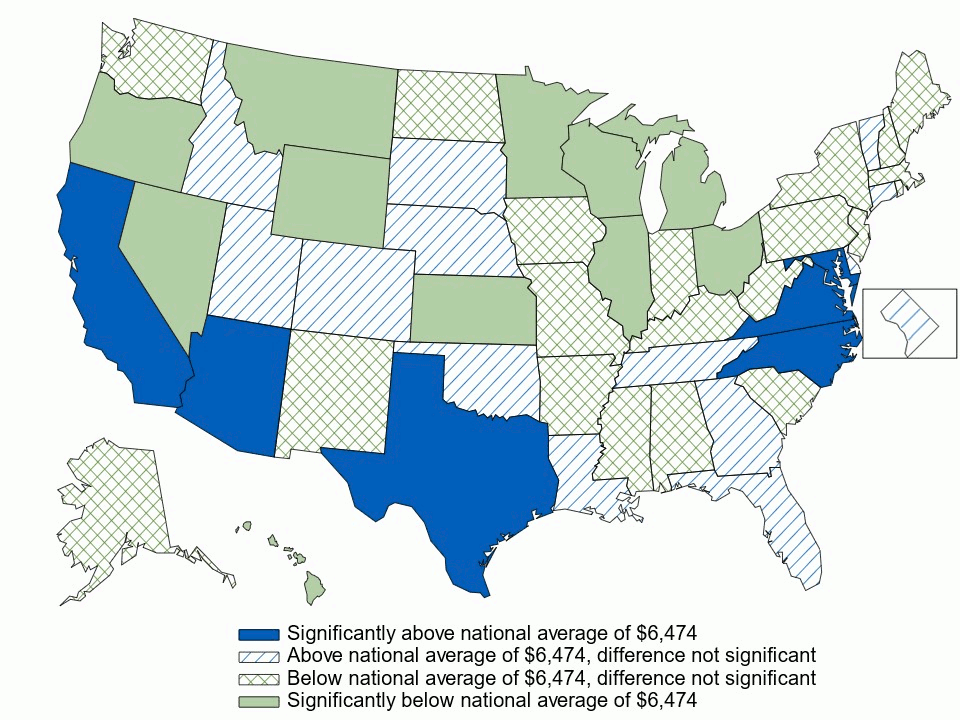
Source: Center for Financing, Access, and Cost Trends, Agency for Healthcare Research and Quality, Medical Expenditure Panel Survey Insurance Component, private-sector establishments, 2021–2023. Note: * Indicates the estimate is statistically different from the national average of $6,474 at p < 0.05. |
||||||||||||||||||||||||||||||||||||||||||||||||||||||||||||||||||||||||||||||||||||||||||||||||||||||||||||
Figure 10. Percentage of private-sector enrolled employees in a health insurance plan with a deductible, by state, 3-year average, 2021–2023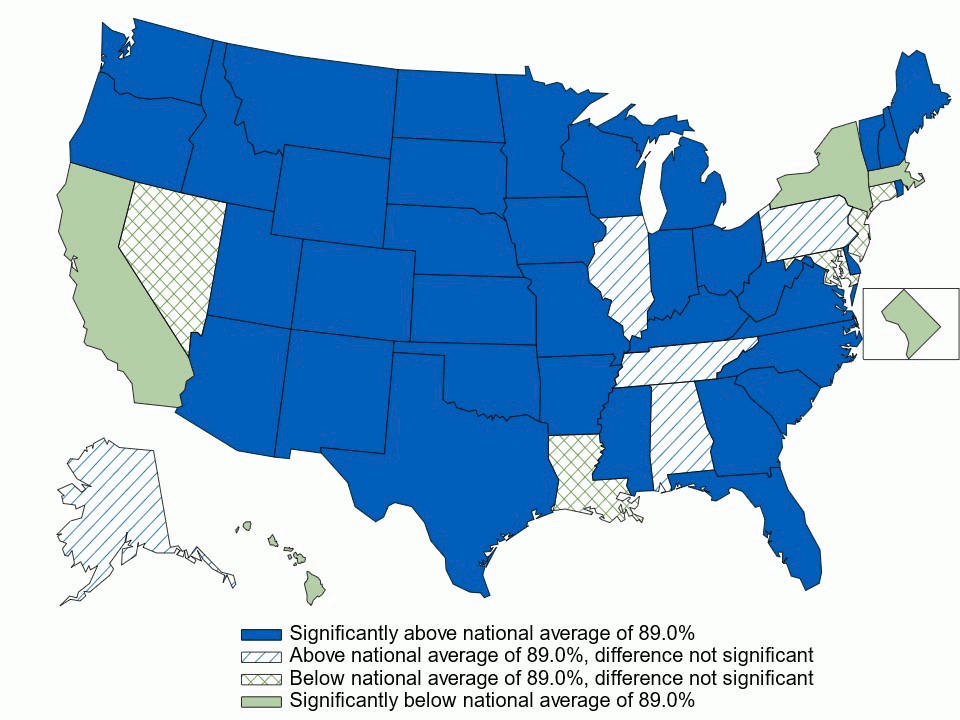
Source: Center for Financing, Access, and Cost Trends, Agency for Healthcare Research and Quality, Medical Expenditure Panel Survey Insurance Component, private-sector establishments, 2021–2023. Note: * Indicates the estimate is statistically different from the national average of 89.0% at p < 0.05. |
||||||||||||||||||||||||||||||||||||||||||||||||||||||||||||||||||||||||||||||||||||||||||||||||||||||||||||
Figure 11. Average individual deductible (in dollars) per employee enrolled with single coverage in a health insurance plan with a deductible, by state, 3-year average, 2021–2023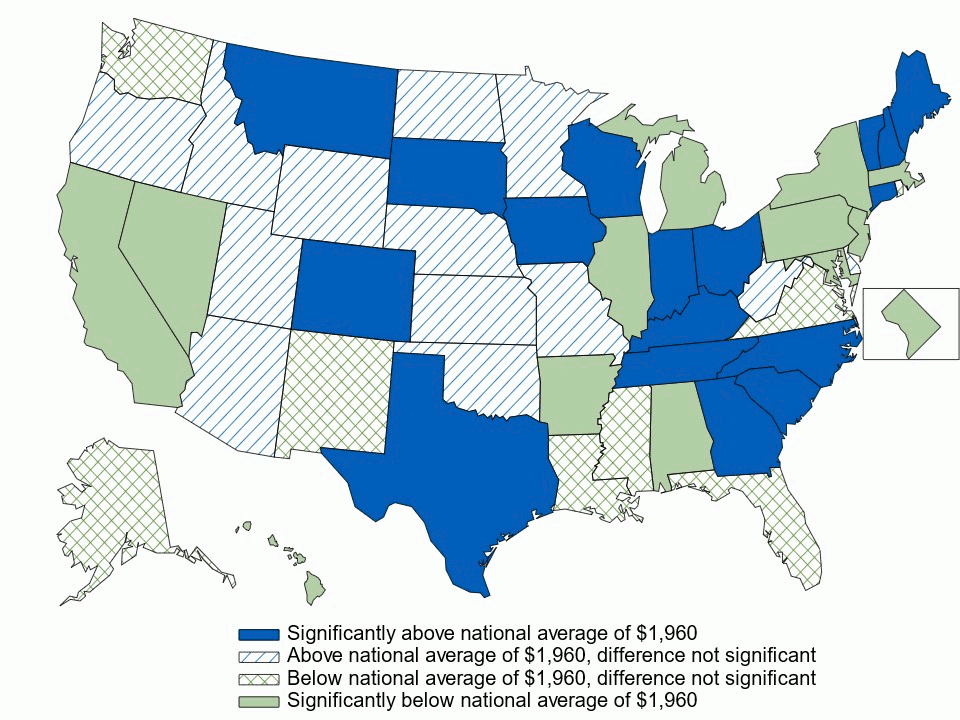
Source: Center for Financing, Access, and Cost Trends, Agency for Healthcare Research and Quality, Medical Expenditure Panel Survey Insurance Component, private-sector establishments, 2021–2023. Note: * Indicates the estimate is statistically different from the national average of $1,960 at p < 0.05. |
||||||||||||||||||||||||||||||||||||||||||||||||||||||||||||||||||||||||||||||||||||||||||||||||||||||||||||
Figure 12. Average family deductible (in dollars) per employee enrolled with family coverage in a health insurance plan with a deductible, by state, 3-year average, 2021–2023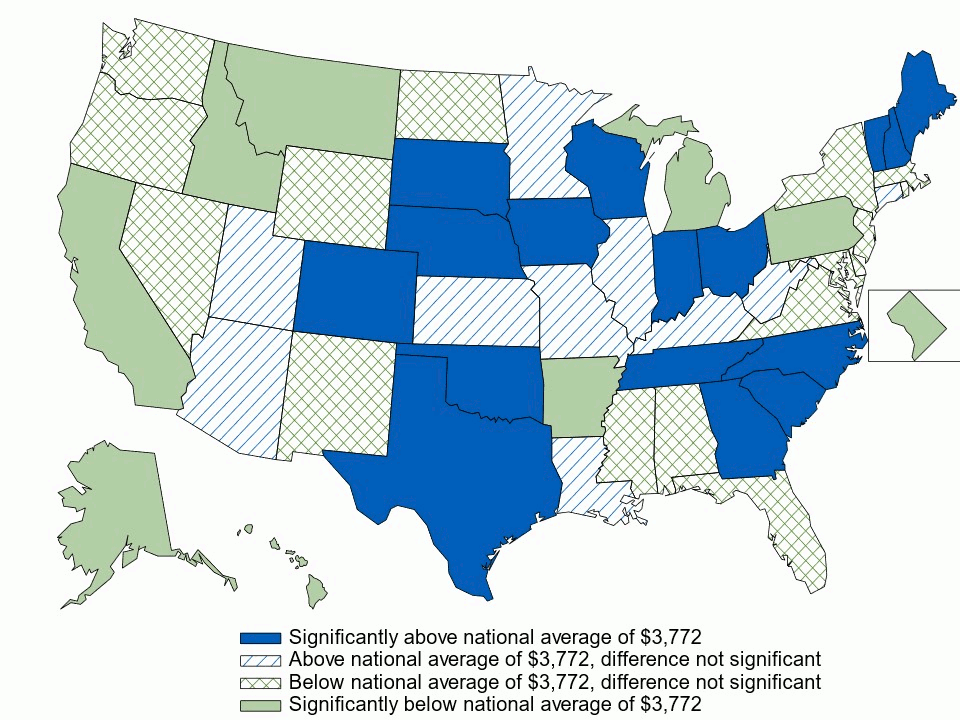
Source: Center for Financing, Access, and Cost Trends, Agency for Healthcare Research and Quality, Medical Expenditure Panel Survey Insurance Component, private-sector establishments, 2021–2023. Note: * Indicates the estimate is statistically different from the national average of $3,772 at p < 0.05. |
||||||||||||||||||||||||||||||||||||||||||||||||||||||||||||||||||||||||||||||||||||||||||||||||||||||||||||
Figure 13. Among private-sector enrolled employees with single coverage, percentage in a high-deductible health insurance plan, by state, 3-year average, 2021–2023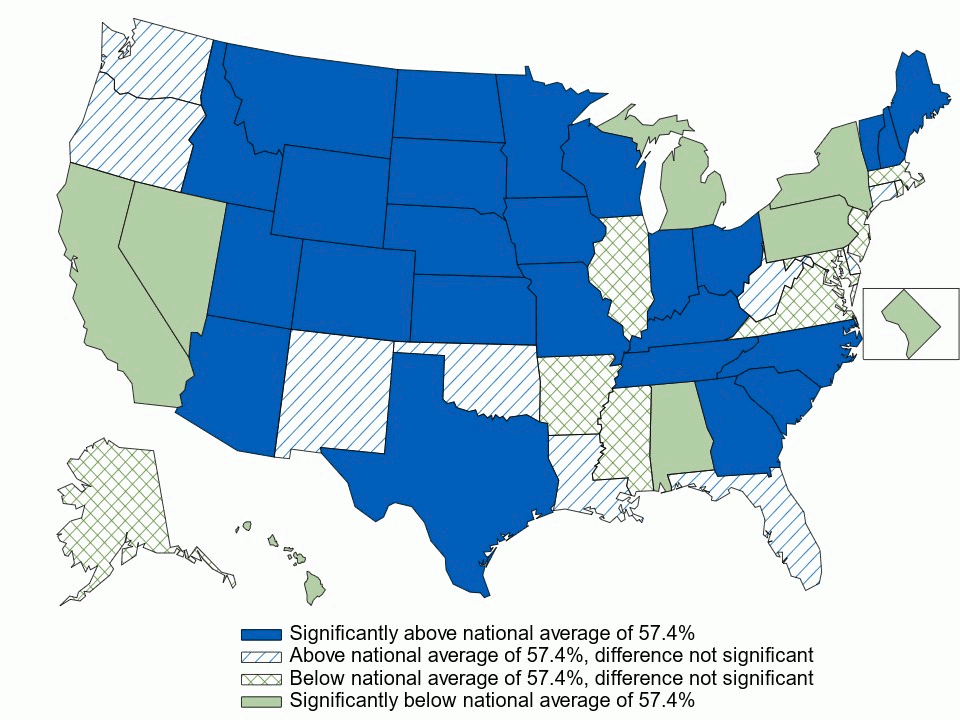
Source: Center for Financing, Access, and Cost Trends, Agency for Healthcare Research and Quality, Medical Expenditure Panel Survey Insurance Component, private-sector establishments, 2021–2023. Note: * Indicates the estimate is statistically different from the national average of 57.4% at p < 0.05. |
||||||||||||||||||||||||||||||||||||||||||||||||||||||||||||||||||||||||||||||||||||||||||||||||||||||||||||
Figure 14. Among private-sector enrolled employees with family coverage, percentage in a high-deductible health insurance plan, by state, 3-year average, 2021–2023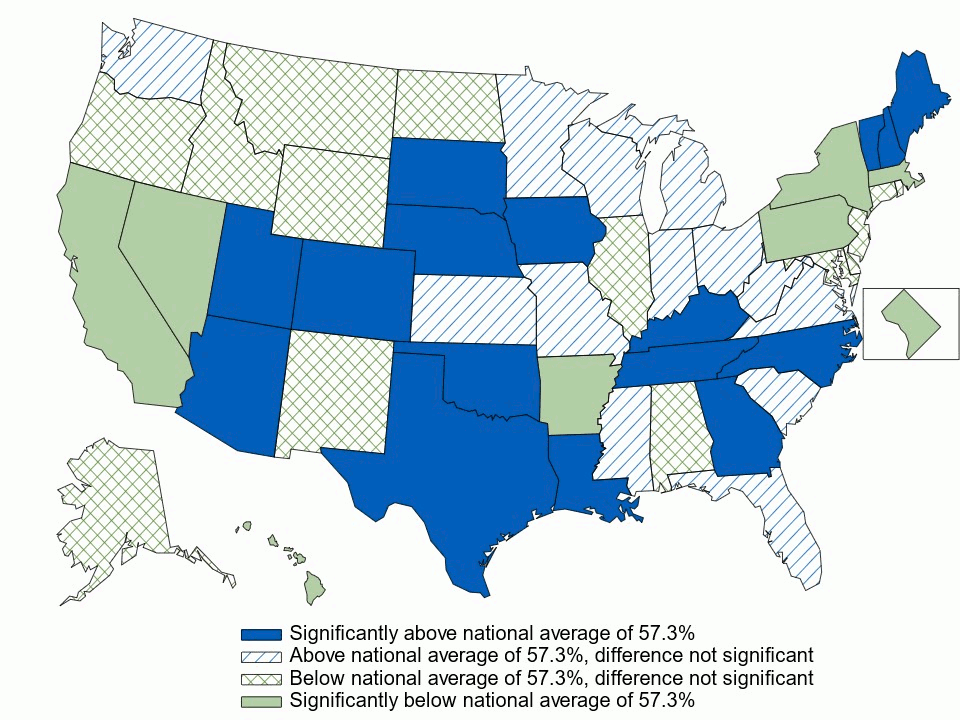
Source: Center for Financing, Access, and Cost Trends, Agency for Healthcare Research and Quality, Medical Expenditure Panel Survey Insurance Component, private-sector establishments, 2021–2023. Note: * Indicates the estimate is statistically different from the national average of 57.3% at p < 0.05. |
||||||||||||||||||||||||||||||||||||||||||||||||||||||||||||||||||||||||||||||||||||||||||||||||||||||||||||
Figure 15. Average individual deductible (in dollars) per employee enrolled with single coverage in a high-deductible health insurance plan, by state, 3-year average, 2021–2023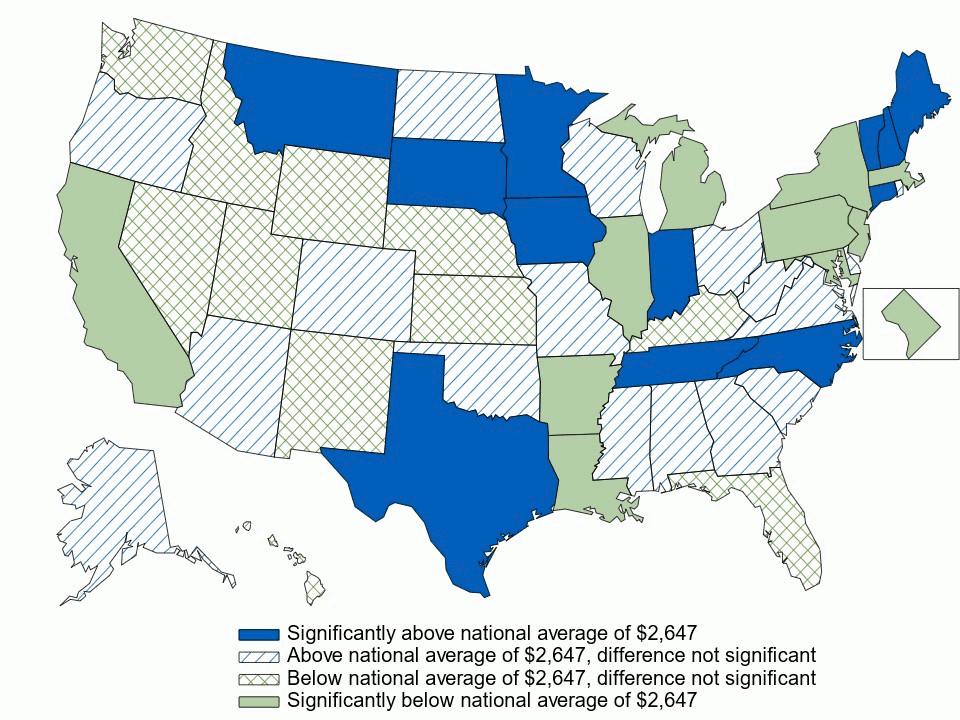
Source: Center for Financing, Access, and Cost Trends, Agency for Healthcare Research and Quality, Medical Expenditure Panel Survey Insurance Component, private-sector establishments, 2021–2023. Note: * Indicates the estimate is statistically different from the national average of $2,647 at p < 0.05. |
||||||||||||||||||||||||||||||||||||||||||||||||||||||||||||||||||||||||||||||||||||||||||||||||||||||||||||
Figure 16. Average family deductible (in dollars) per employee enrolled with family coverage in a high-deductible health insurance plan, by state, 3-year average, 2021–2023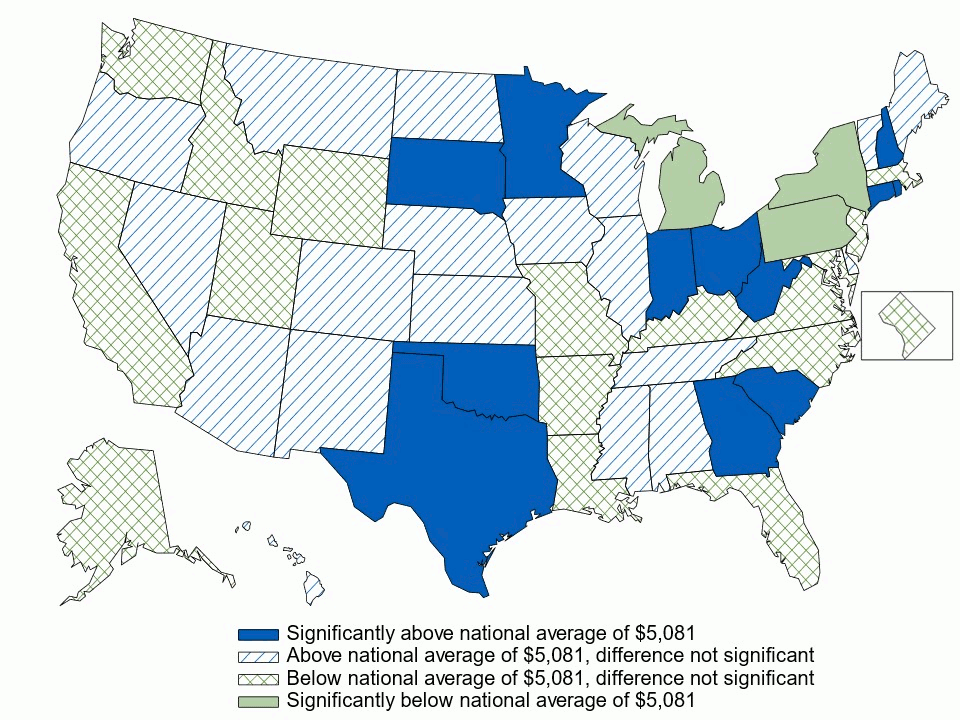
Source: Center for Financing, Access, and Cost Trends, Agency for Healthcare Research and Quality, Medical Expenditure Panel Survey Insurance Component, private-sector establishments, 2021–2023. Note: * Indicates the estimate is statistically different from the national average of $5,081 at p < 0.05. |
||||||||||||||||||||||||||||||||||||||||||||||||||||||||||||||||||||||||||||||||||||||||||||||||||||||||||||
|
| ||||||||||||||||||||||||||||||||||||||||||||||||||||||||||||||||||||||||||||||||||||||||||||||||||||||||||||


